Fig. A.1
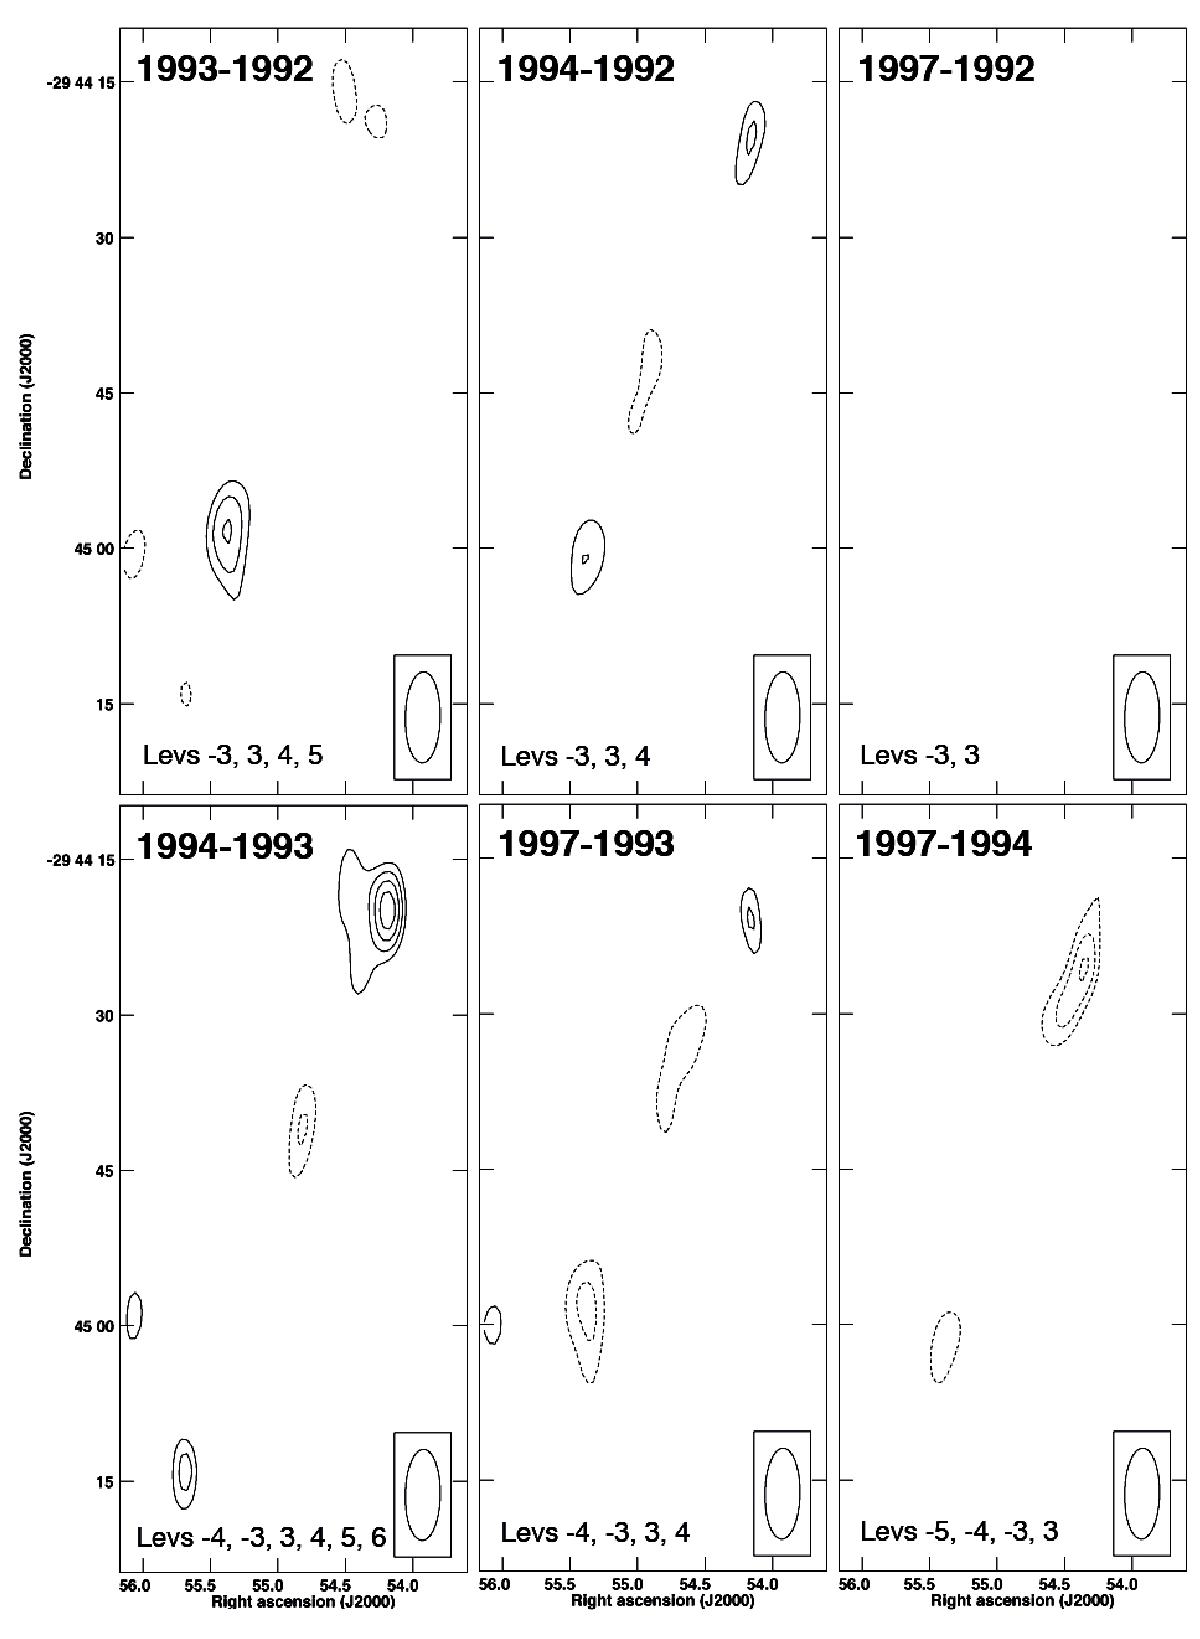
Residuals obtained from the differences between the maps in Fig. 2, as indicated on top of each frame. From left to right and up to down, the rms noise in μJy beam-1 is 28, 28, 29.6, 28, 29, and 29, respectively. Contour levels are given in units of rms noise at the bottom of each panel. All residuals tend to be well aligned with the jet position angle. The map corresponding to the 2000 epoch has not been used because 1E 1740.7−2942 was not at the phase center and the primary beam corrections would then render the difference maps meaningless.
Current usage metrics show cumulative count of Article Views (full-text article views including HTML views, PDF and ePub downloads, according to the available data) and Abstracts Views on Vision4Press platform.
Data correspond to usage on the plateform after 2015. The current usage metrics is available 48-96 hours after online publication and is updated daily on week days.
Initial download of the metrics may take a while.