Free Access
Fig. 3
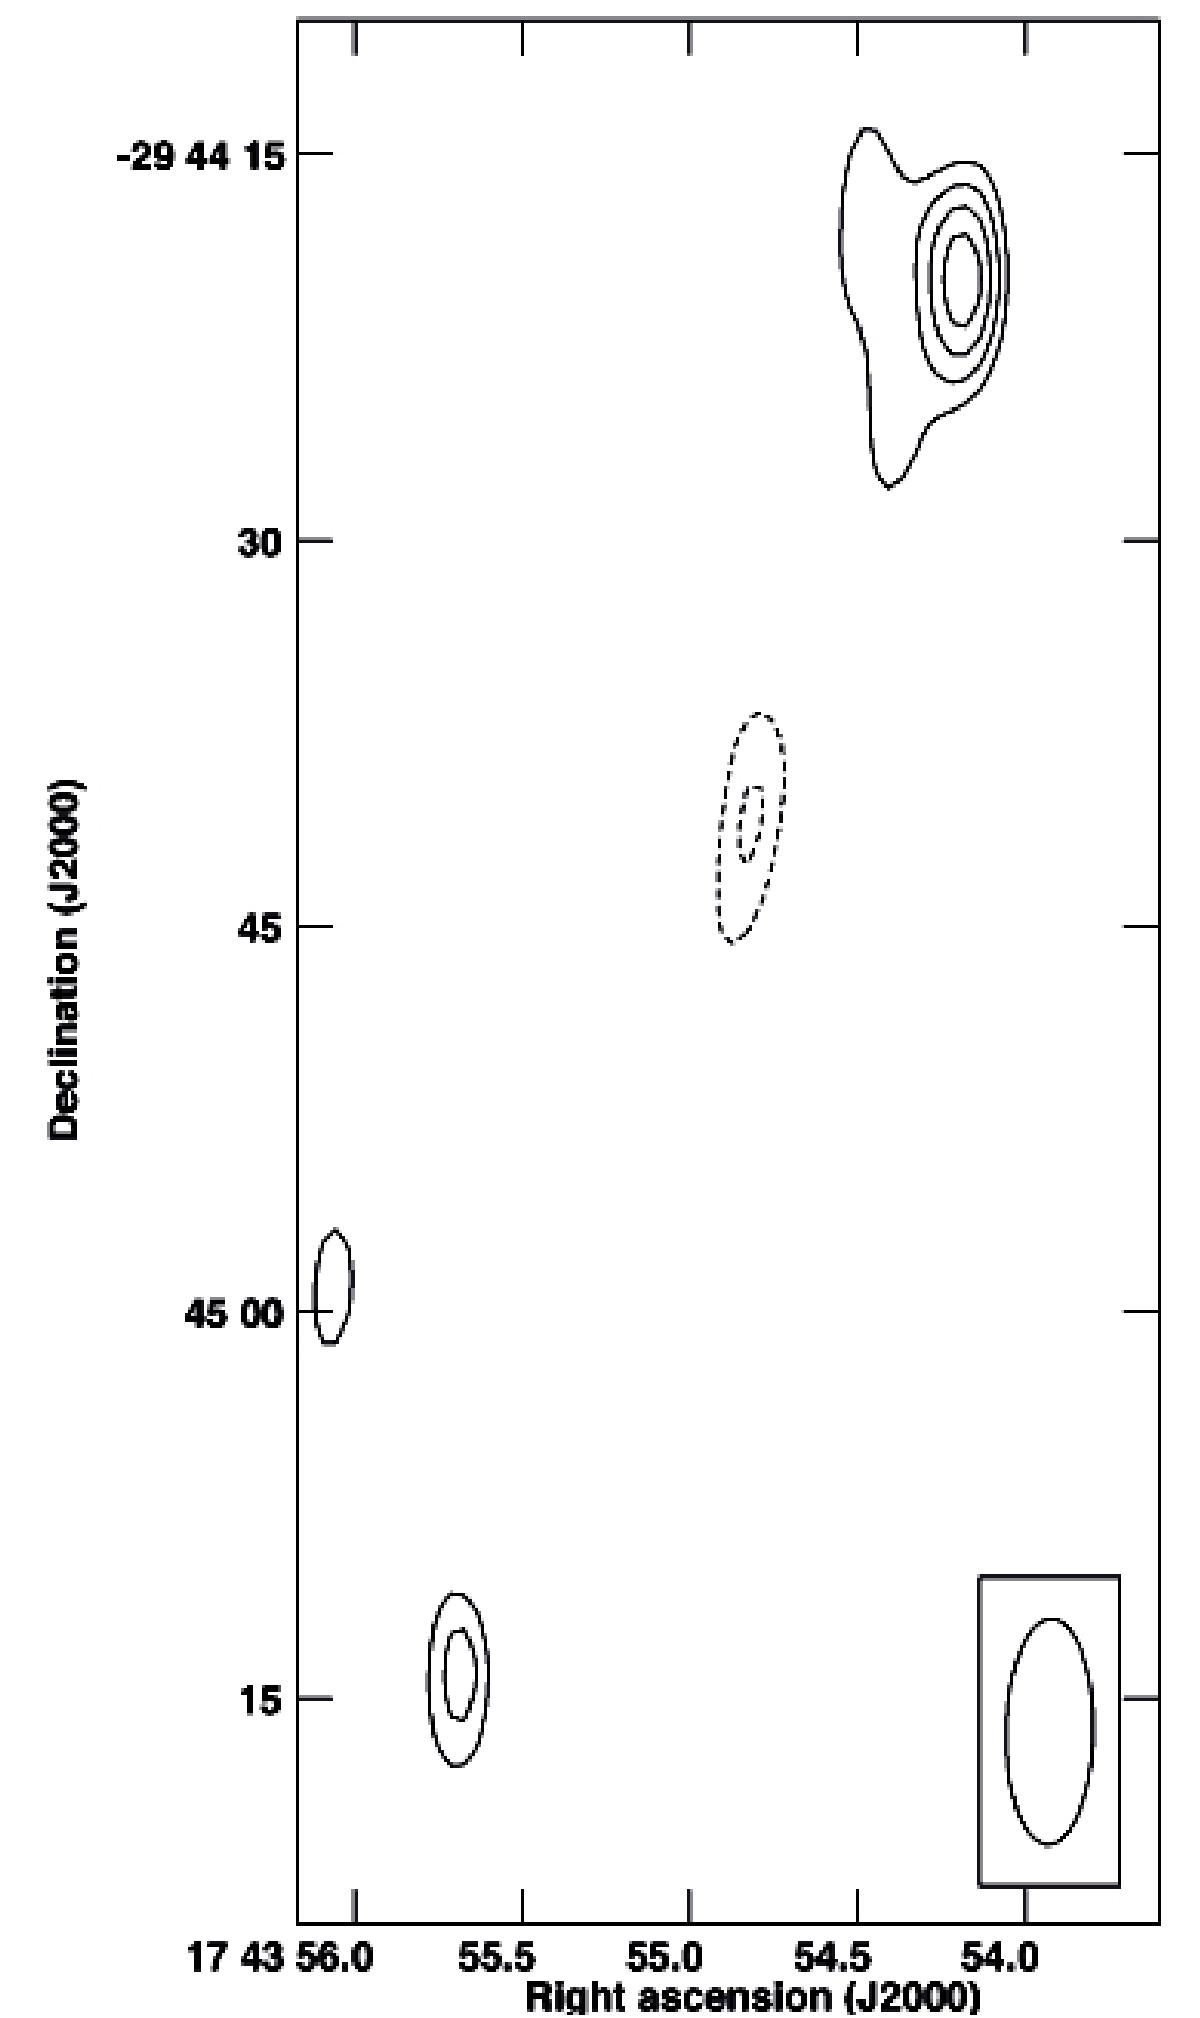
One of the six maps of residuals obtained from the differences of the epochs shown in Fig. 2. This one corresponds to the difference between the 1993 and the 1994 epochs. The rest of residual maps may be seen in Appendix A. Contour levels are −5, −3, 0, 2, 4, 6 times the rms noise, which amounts 28 μJy.
Current usage metrics show cumulative count of Article Views (full-text article views including HTML views, PDF and ePub downloads, according to the available data) and Abstracts Views on Vision4Press platform.
Data correspond to usage on the plateform after 2015. The current usage metrics is available 48-96 hours after online publication and is updated daily on week days.
Initial download of the metrics may take a while.