Fig. 3
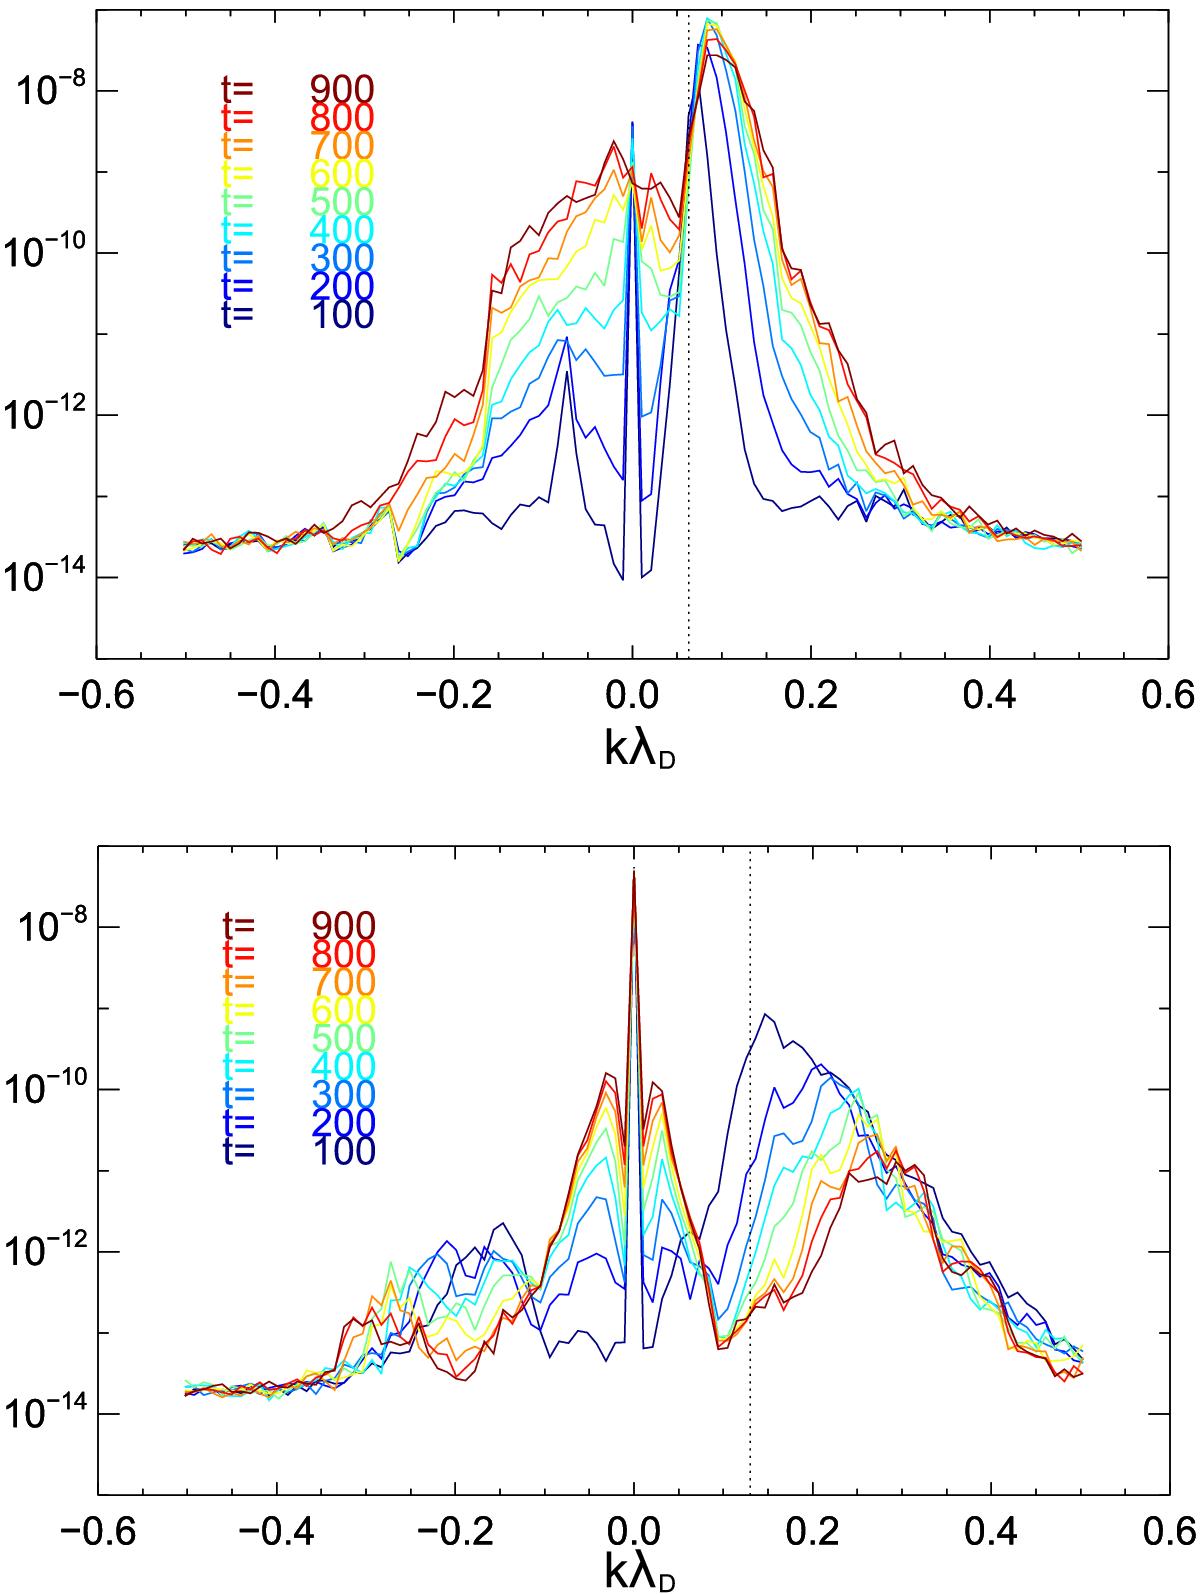
Spectral energy density (J m-3) along the Langmuir wave dispersion curve for Run 1 (top) and Run 2 (bottom) for subsequent ![]() time windows (centred
time windows (centred ![]() about the indicated time). Note the development of a broad spectrum in negative kx in Run 1 with energy densities several orders of magntude larger than the negative kx spectrum of Run 2. The dotted lines show the expected initial kx value of the initially growing electrostatic modes.
about the indicated time). Note the development of a broad spectrum in negative kx in Run 1 with energy densities several orders of magntude larger than the negative kx spectrum of Run 2. The dotted lines show the expected initial kx value of the initially growing electrostatic modes.
Current usage metrics show cumulative count of Article Views (full-text article views including HTML views, PDF and ePub downloads, according to the available data) and Abstracts Views on Vision4Press platform.
Data correspond to usage on the plateform after 2015. The current usage metrics is available 48-96 hours after online publication and is updated daily on week days.
Initial download of the metrics may take a while.