Fig. 1
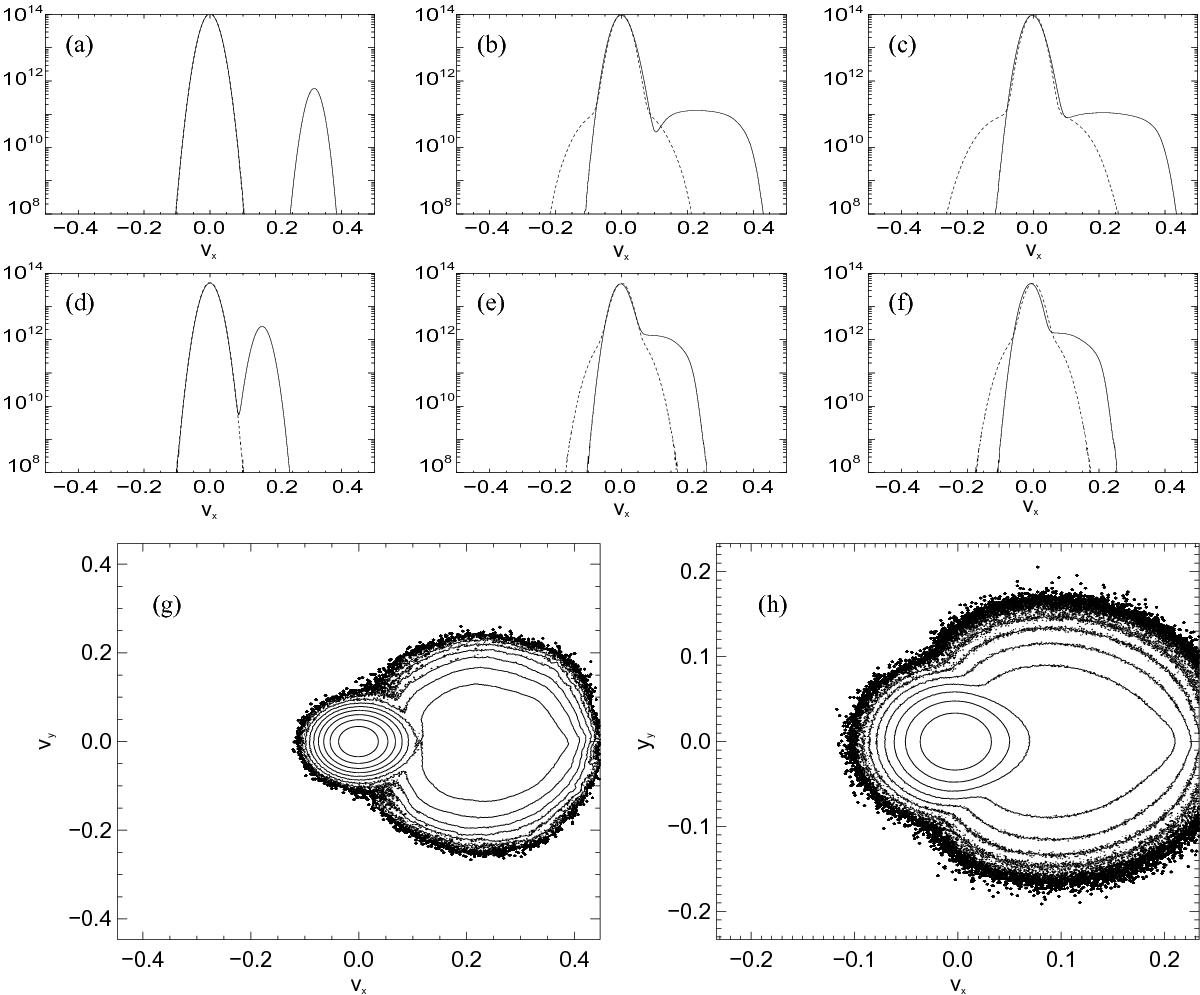
Electron velocity distribution functions for Run 1 (a)–c)) and Run 2 (d)–f)) at times ![]() respectively. The solid line shows the velocity distribution aligned with the beam (vx) and the dashed line shows the transverse velocity (vy). Panels g) and h) are representative of the behaviour in 2D phase-space for Run 1 and 2 respectively at
respectively. The solid line shows the velocity distribution aligned with the beam (vx) and the dashed line shows the transverse velocity (vy). Panels g) and h) are representative of the behaviour in 2D phase-space for Run 1 and 2 respectively at ![]() . Note the plateau formation in vx with the saturation of the bump-in-tail instability, and the transverse heating of the beam electrons due to the Weibel instability.
. Note the plateau formation in vx with the saturation of the bump-in-tail instability, and the transverse heating of the beam electrons due to the Weibel instability.
Current usage metrics show cumulative count of Article Views (full-text article views including HTML views, PDF and ePub downloads, according to the available data) and Abstracts Views on Vision4Press platform.
Data correspond to usage on the plateform after 2015. The current usage metrics is available 48-96 hours after online publication and is updated daily on week days.
Initial download of the metrics may take a while.