Fig. 13
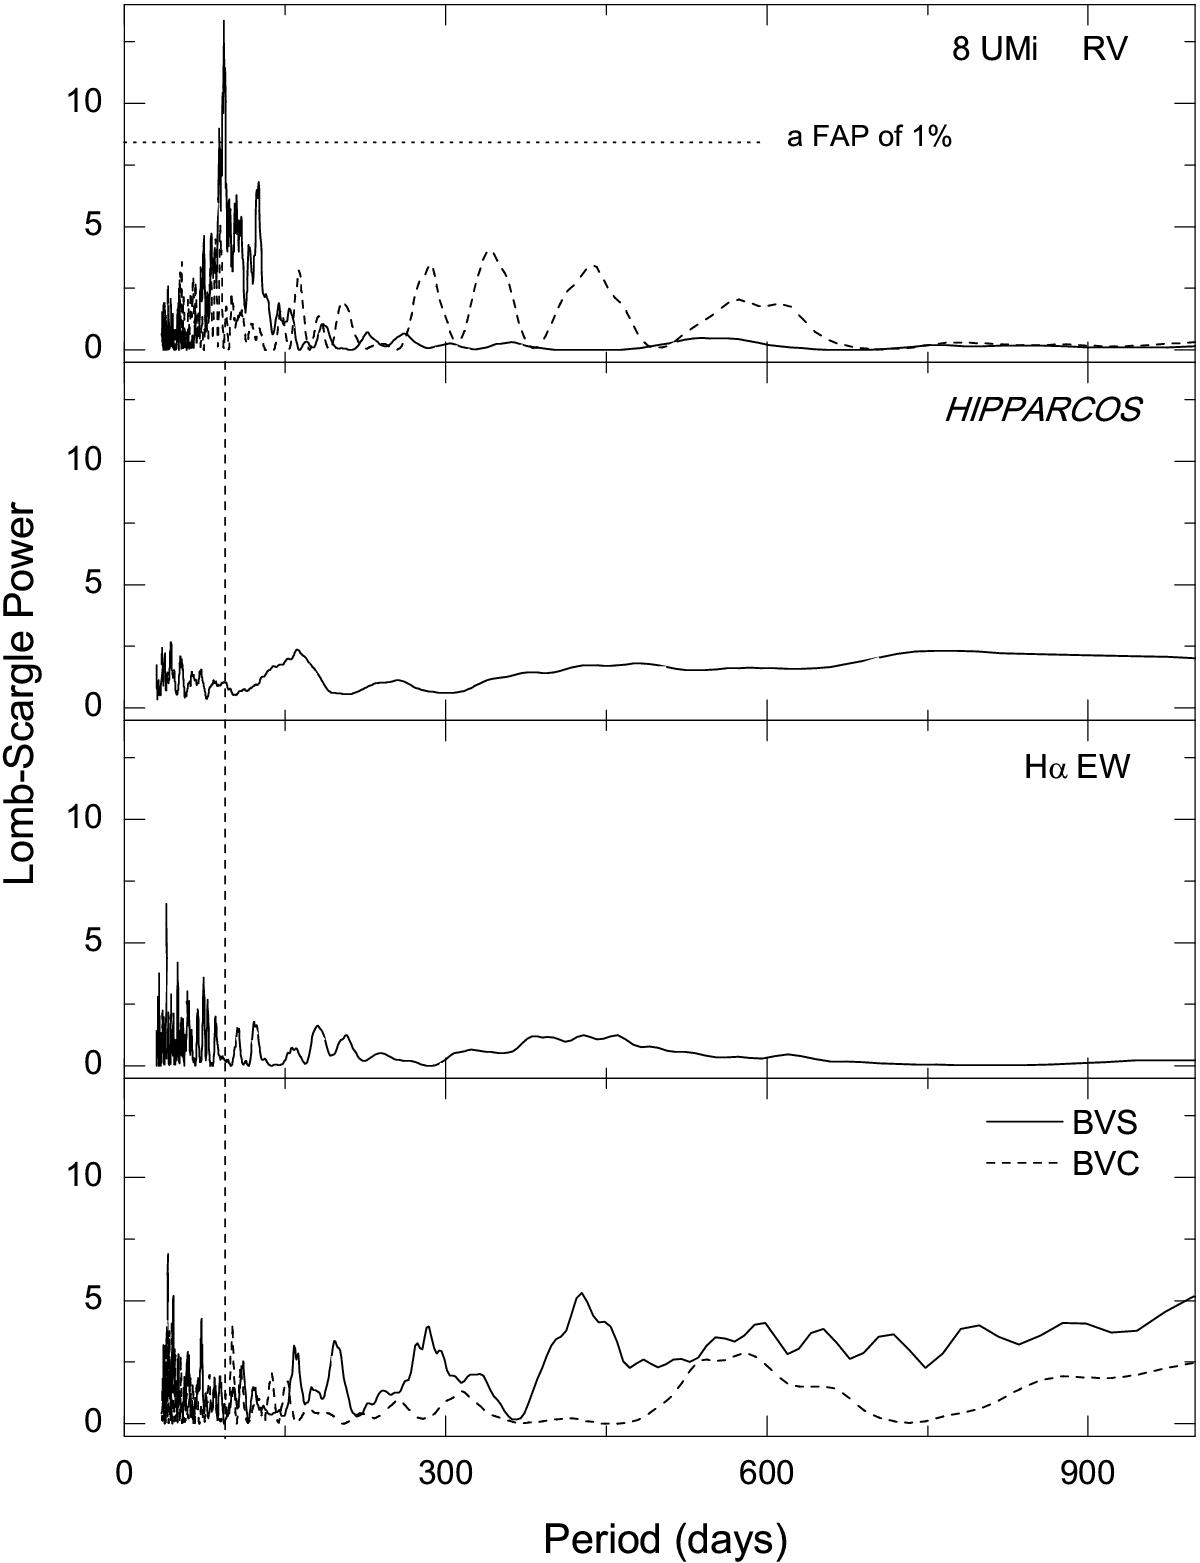
L-S periodograms of the RV measurements, the Hipparcos photometric measurements, the Hα EW variations, and the bisector variations for 8 UMi (top to bottom panel). The vertical dashed line shows the location of the period of 93 days. Top panel: the solid line is the L-S periodogram of the RV measurements for five years, and the periodogram shows a significant power at a period of 93.4 days. The dashed line shows the periodogram of the residuals after removing of the main period fit from the original data. The horizontal dotted line indicates a FAP threshold of 1 × 10⁻² (1%).
Current usage metrics show cumulative count of Article Views (full-text article views including HTML views, PDF and ePub downloads, according to the available data) and Abstracts Views on Vision4Press platform.
Data correspond to usage on the plateform after 2015. The current usage metrics is available 48-96 hours after online publication and is updated daily on week days.
Initial download of the metrics may take a while.