Fig. 4
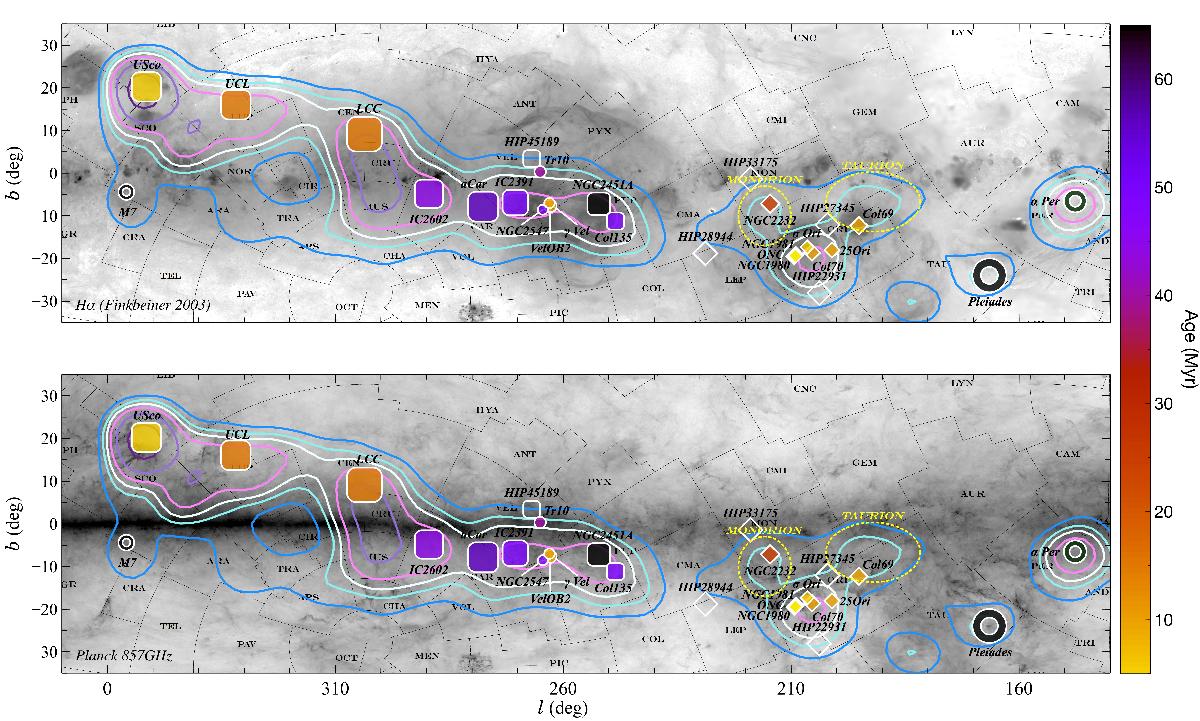
Maximum density of OB stars projected on an Hα (top panel, Finkbeiner 2003) and Planck 857 GHz (lower panel Planck Collaboration I 2015) image of the sky. Clusters and associations belonging to the Sco-CMa stream are represented by squares. Clusters and associations in the Vela stream are represented by dots. Clusters and associations in the Orion blue stream are represented by diamonds. The Pleiades, α-Per and Messier 7 are represented as circles. The symbol size is inversely proportional to the group distance. The colour scale is proportional to the age when an estimate is available in the literature and transparent otherwise. See also Fig. 1.
Current usage metrics show cumulative count of Article Views (full-text article views including HTML views, PDF and ePub downloads, according to the available data) and Abstracts Views on Vision4Press platform.
Data correspond to usage on the plateform after 2015. The current usage metrics is available 48-96 hours after online publication and is updated daily on week days.
Initial download of the metrics may take a while.