Fig. 3
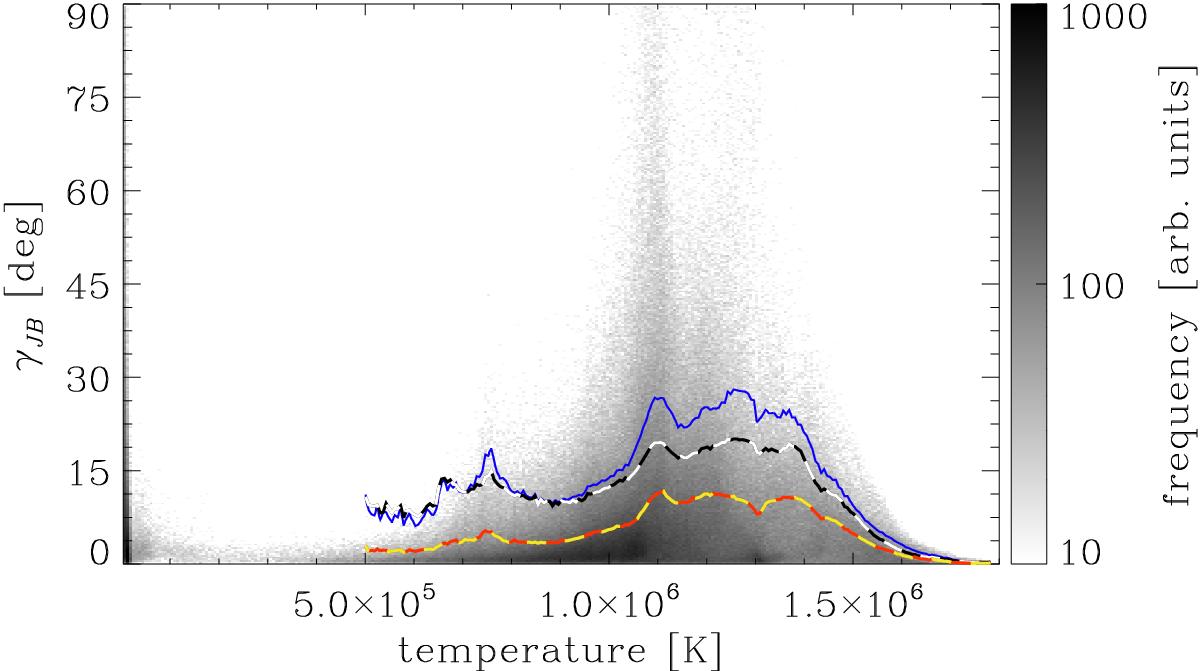
Angle γJB between current and magnetic field in a 3D MHD model. The plot shows a 2D histogram of the angle as a function of temperature in the computational domain (above 5 Mm). The yellow-red dashed line indicates the median variation, the white-black dashed line the mean variation. The solid blue line shows the 75 percentile, i.e. still 25% of all data points have angles above the blue line. The colour bar shows the frequency in the histogram. Data based on the model presented in Bingert & Peter (2011); see Sect. 4.3.
Current usage metrics show cumulative count of Article Views (full-text article views including HTML views, PDF and ePub downloads, according to the available data) and Abstracts Views on Vision4Press platform.
Data correspond to usage on the plateform after 2015. The current usage metrics is available 48-96 hours after online publication and is updated daily on week days.
Initial download of the metrics may take a while.