Fig. 2
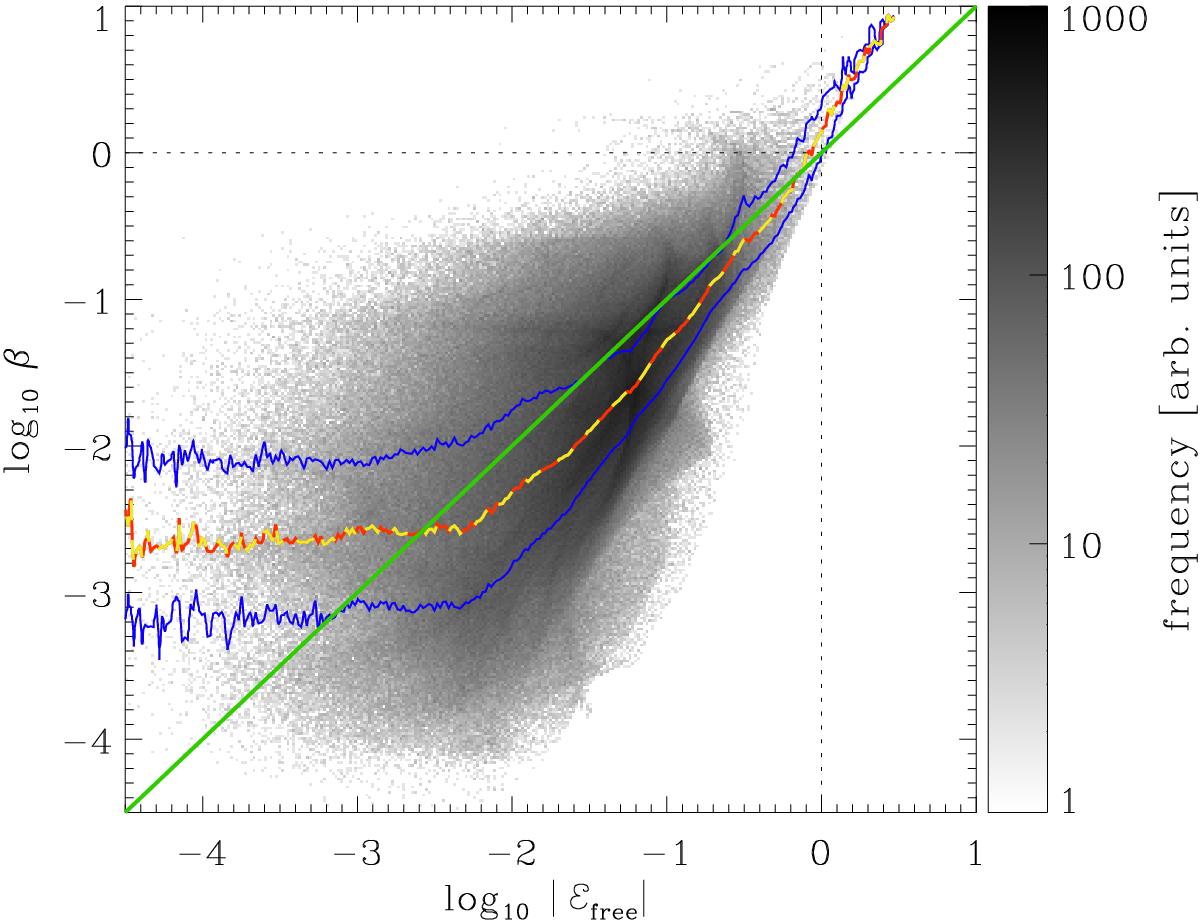
Relation between plasma β and relative free magnetic energy ℰfree in a 3D MHD model. For the 2D histogram plasma β (1) is calculated at each grid cell of the computational domain (above 5 Mm) and the free energy ℰfree is evaluated according to (3) in the volume of the same respective cell. Here we plot the absolute values, | ℰfree |. The potential field required for this is calculated using the vertical component of the magnetic field in the 3D model at a height of 5 Mm, which is (roughly) the base of the corona in that model. The yellow-red dashed line indicates the median variation (here similar to the mean variation). The solid blue lines show the 25 and 75 percentiles, i.e. half of the data points are in between these lines. For comparison, the straight green line shows a linear relation β = ℰfree. The colour bar shows the frequency in the 2D histogram. Data based on the model presented in Bingert & Peter (2011); see Sect. 4.2.
Current usage metrics show cumulative count of Article Views (full-text article views including HTML views, PDF and ePub downloads, according to the available data) and Abstracts Views on Vision4Press platform.
Data correspond to usage on the plateform after 2015. The current usage metrics is available 48-96 hours after online publication and is updated daily on week days.
Initial download of the metrics may take a while.