Fig. 14
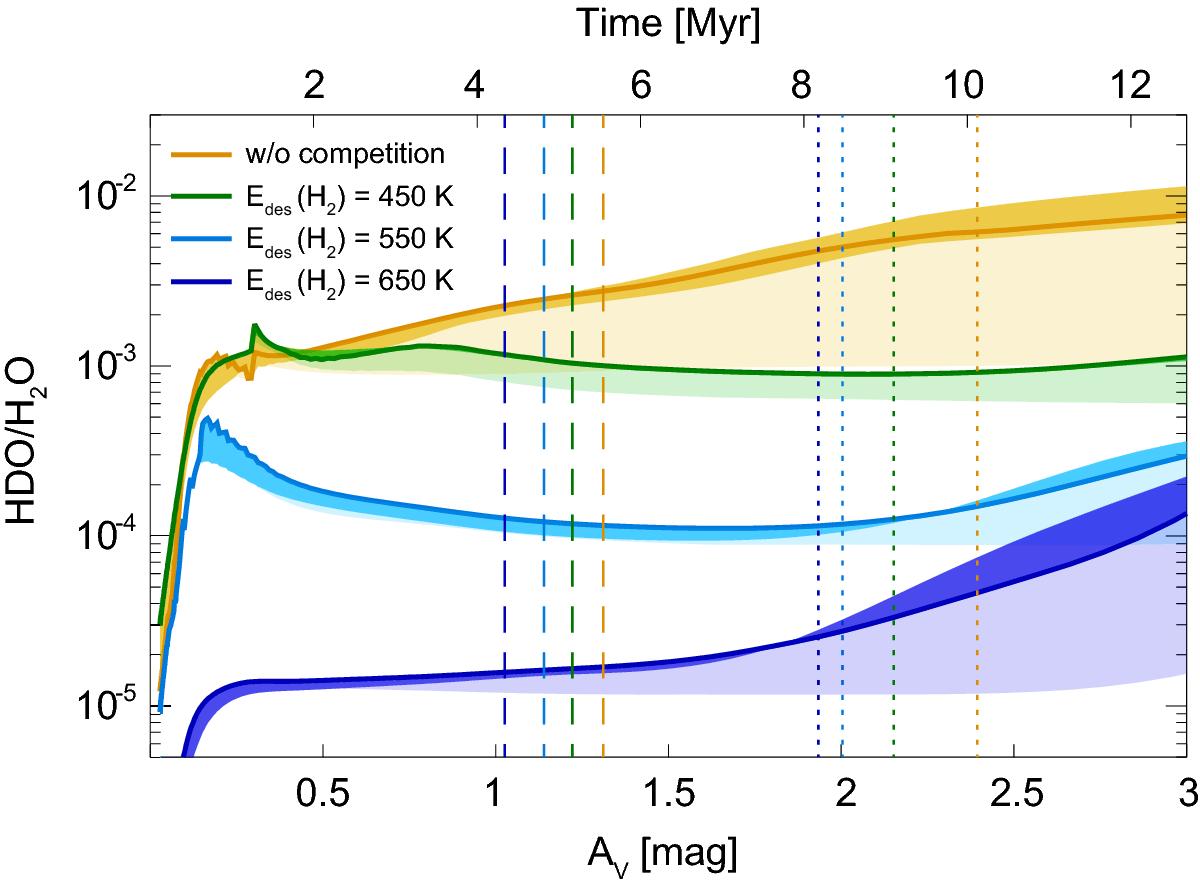
HDO / H2O ratio in the bulk ice in the two grids (with and without the reaction-diffusion competition) of models as functions of AV. For the case without the competition (yellow), the solid line represents the model with Nact = 4, Edes(H2) = 550 K, and the low-metal abundances. The areas represent the models including variations in Nact and Edes(H2), while the light-colored areas represent the models including variations in Nact, Edes(H2), and the initial abundances. For the case with the competition, the models with different Edes(H2) are shown by different colors. The solid lines represent the models with Nact = 4. The areas represent models including the variations in Nact, while the light-colored areas represent the models including the variations in Nact and the initial abundances. The vertical dashed and dotted lines indicate the regions where the fraction of elemental oxygen in the atomic form becomes less than 10% and 1%, respectively, in the models represented by the solid lines.
Current usage metrics show cumulative count of Article Views (full-text article views including HTML views, PDF and ePub downloads, according to the available data) and Abstracts Views on Vision4Press platform.
Data correspond to usage on the plateform after 2015. The current usage metrics is available 48-96 hours after online publication and is updated daily on week days.
Initial download of the metrics may take a while.