Free Access
Fig. 13
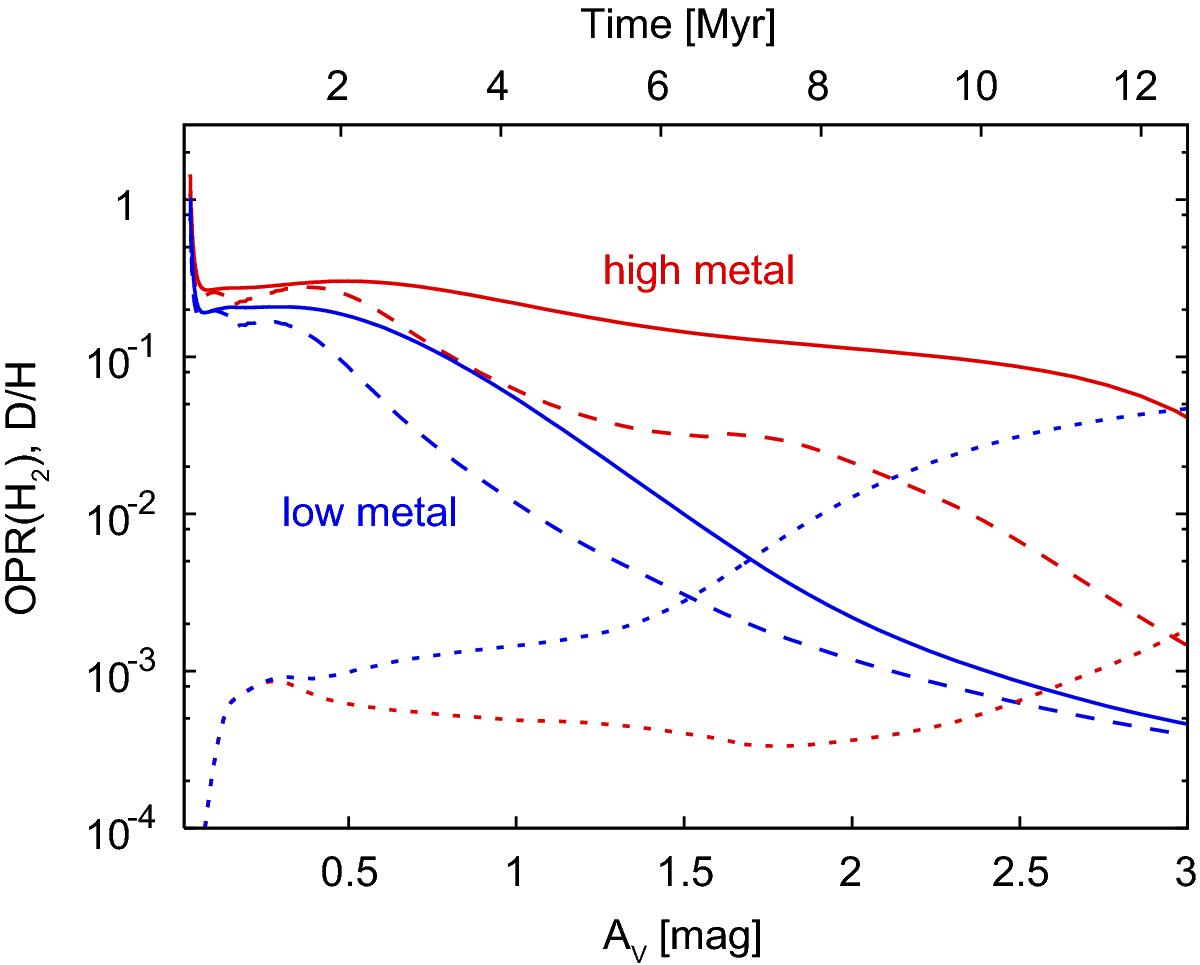
OPR(H2) (solid lines) and atomic D/H ratio (dotted lines) in the gas phase as functions of visual extinction. Red lines indicate the high metal case, while blue lines indicate the low metal case. The dashed lines indicate the steady-state values of the OPR(H2) given by Eq. (14).
Current usage metrics show cumulative count of Article Views (full-text article views including HTML views, PDF and ePub downloads, according to the available data) and Abstracts Views on Vision4Press platform.
Data correspond to usage on the plateform after 2015. The current usage metrics is available 48-96 hours after online publication and is updated daily on week days.
Initial download of the metrics may take a while.