Free Access
Fig. 5
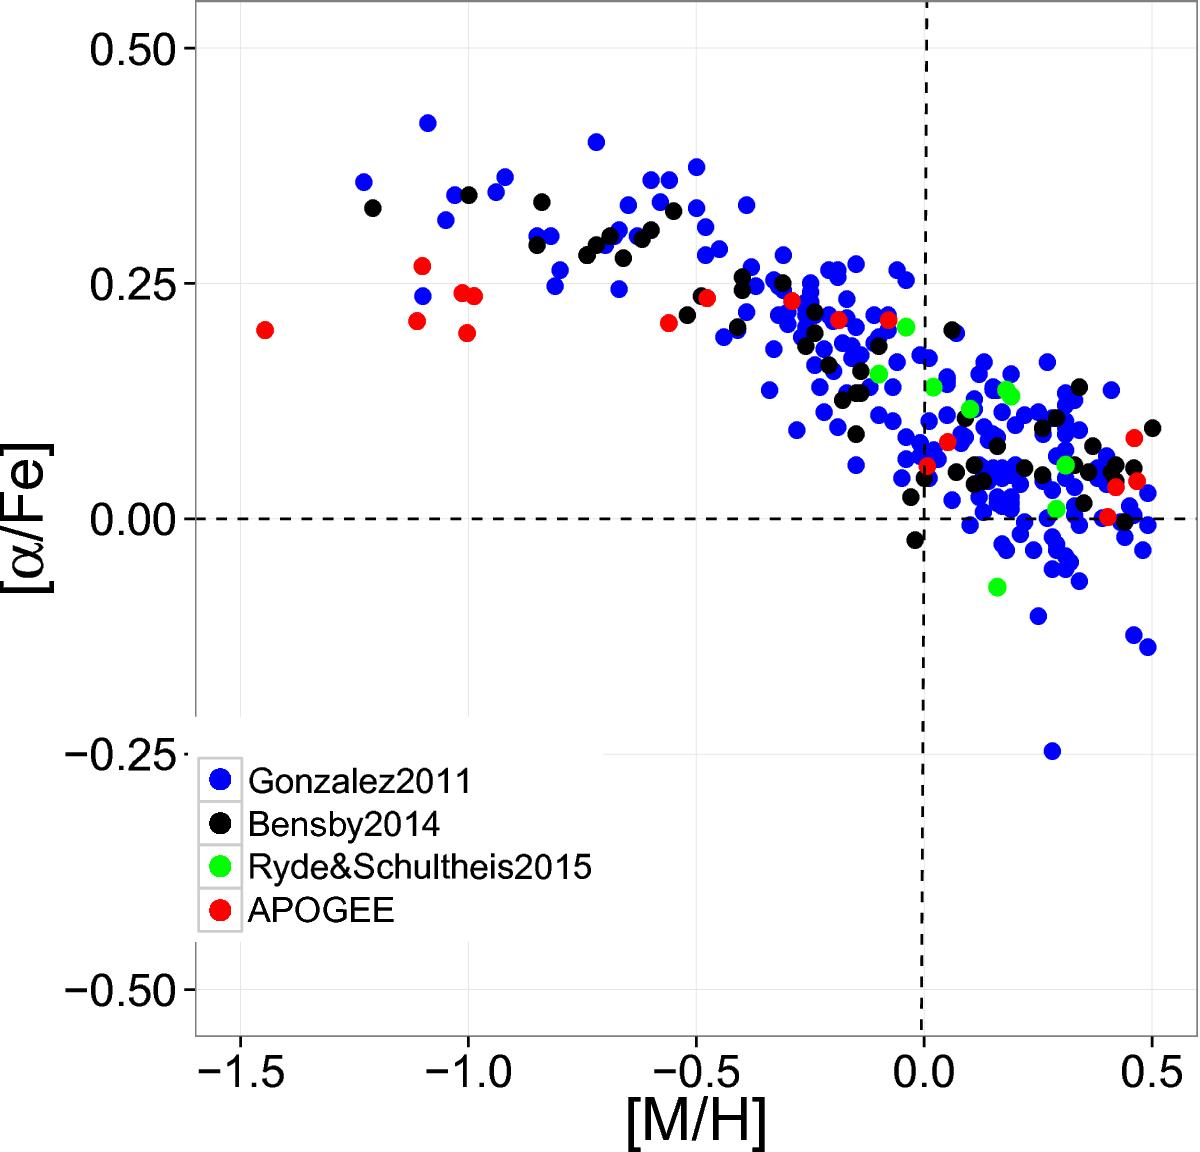
α vs. [M/H]. The blue filled circles indicate the Galactic bulge data from Gonzalez et al. (2011), black from Bensby et al. (2013), green from Ryde & Schultheis (2015), and in red those of our GALCEN sources. We used only stars with Teff> 3700 K.
Current usage metrics show cumulative count of Article Views (full-text article views including HTML views, PDF and ePub downloads, according to the available data) and Abstracts Views on Vision4Press platform.
Data correspond to usage on the plateform after 2015. The current usage metrics is available 48-96 hours after online publication and is updated daily on week days.
Initial download of the metrics may take a while.