Fig. 8
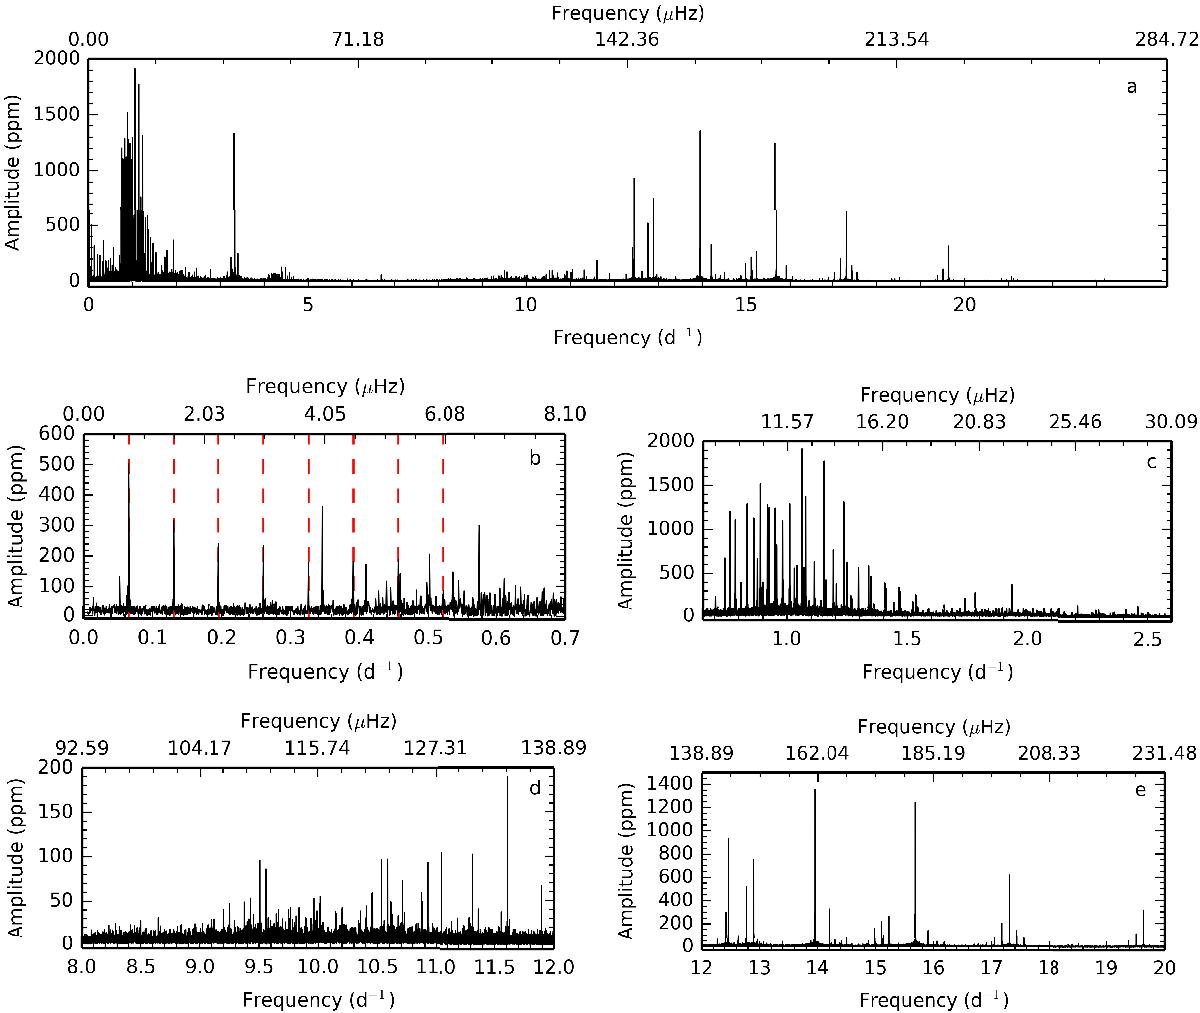
Panel a): periodogram of the original light curve of four years of Kepler data. Panel b): zoom into the long period range, where the orbital harmonics are indicated by the vertical dashed lines. Panel c): zoom into the g-mode pulsations. Panel d): zoom into the low-amplitude p modes and into the high-amplitude p modes (panel e)).
Current usage metrics show cumulative count of Article Views (full-text article views including HTML views, PDF and ePub downloads, according to the available data) and Abstracts Views on Vision4Press platform.
Data correspond to usage on the plateform after 2015. The current usage metrics is available 48-96 hours after online publication and is updated daily on week days.
Initial download of the metrics may take a while.