Fig. 5
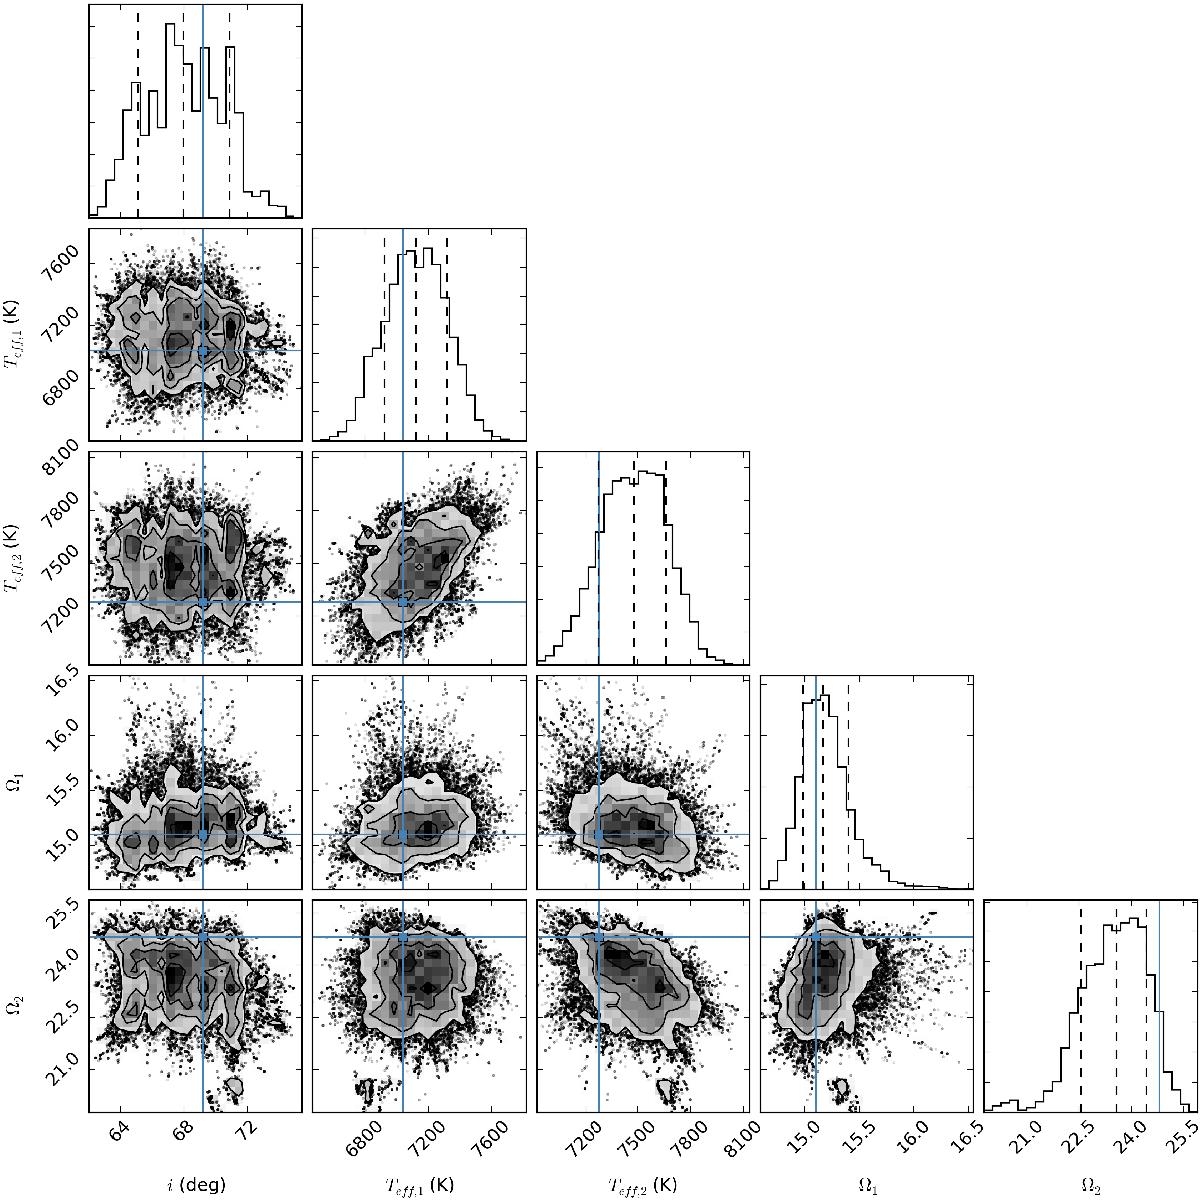
Results of fitting the binary light curve, showing the one- and two-dimensional projections of the posterior probability functions of the parameters inclination i, primary and secondary effective temperature Teff,1,2, and primary and secondary surface potential Ω1,2. The blue squares are the values of the model with the lowest χ2. In the 1-d distributions, the 16th, 50th, and 84th percentile are marked by the vertical dashed lines.
Current usage metrics show cumulative count of Article Views (full-text article views including HTML views, PDF and ePub downloads, according to the available data) and Abstracts Views on Vision4Press platform.
Data correspond to usage on the plateform after 2015. The current usage metrics is available 48-96 hours after online publication and is updated daily on week days.
Initial download of the metrics may take a while.