Free Access
Fig. 3
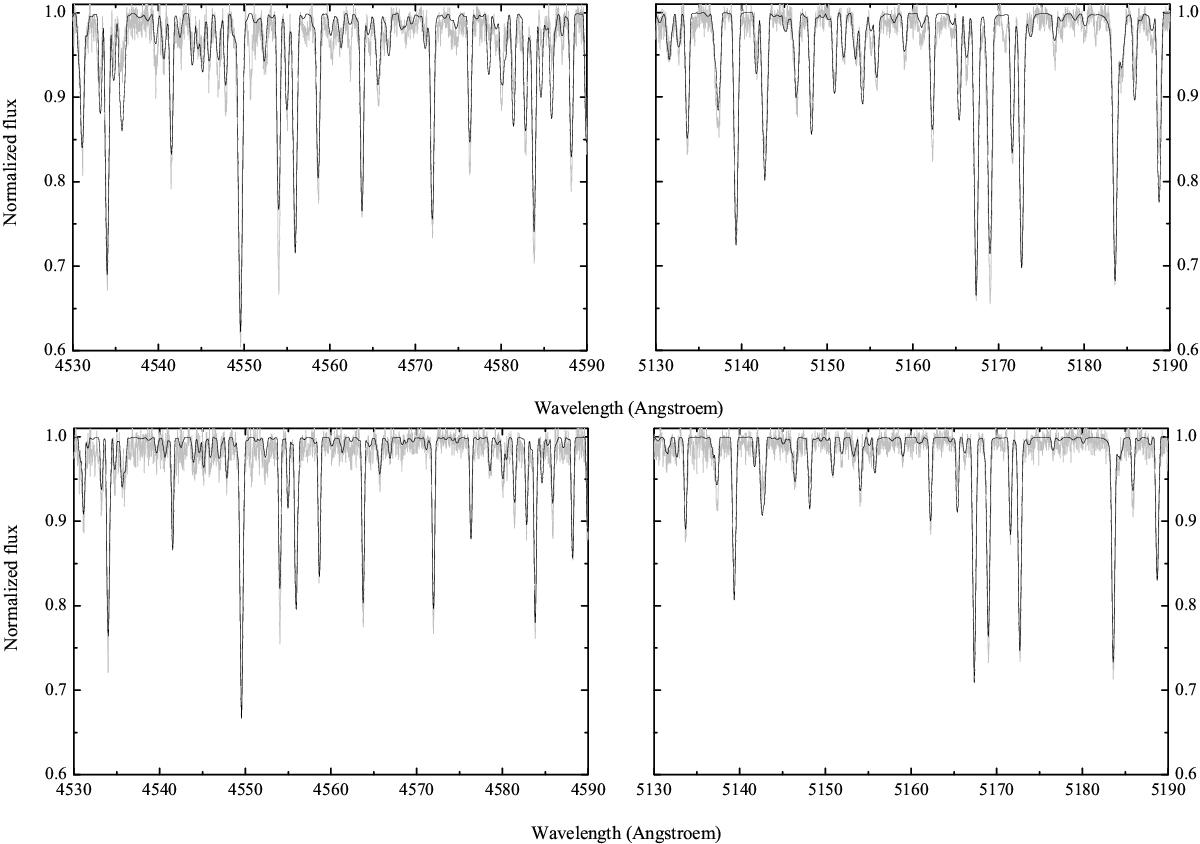
Fit to the disentangled spectra of both components of the KIC 10080943 system (top panels – primary, bottom panels – secondary) with the gssp_binary software package. The observations are shown as the light grey line and the best fit synthetic spectra are illustrated with the black line.
This figure is made of several images, please see below:
Current usage metrics show cumulative count of Article Views (full-text article views including HTML views, PDF and ePub downloads, according to the available data) and Abstracts Views on Vision4Press platform.
Data correspond to usage on the plateform after 2015. The current usage metrics is available 48-96 hours after online publication and is updated daily on week days.
Initial download of the metrics may take a while.