Fig. 2
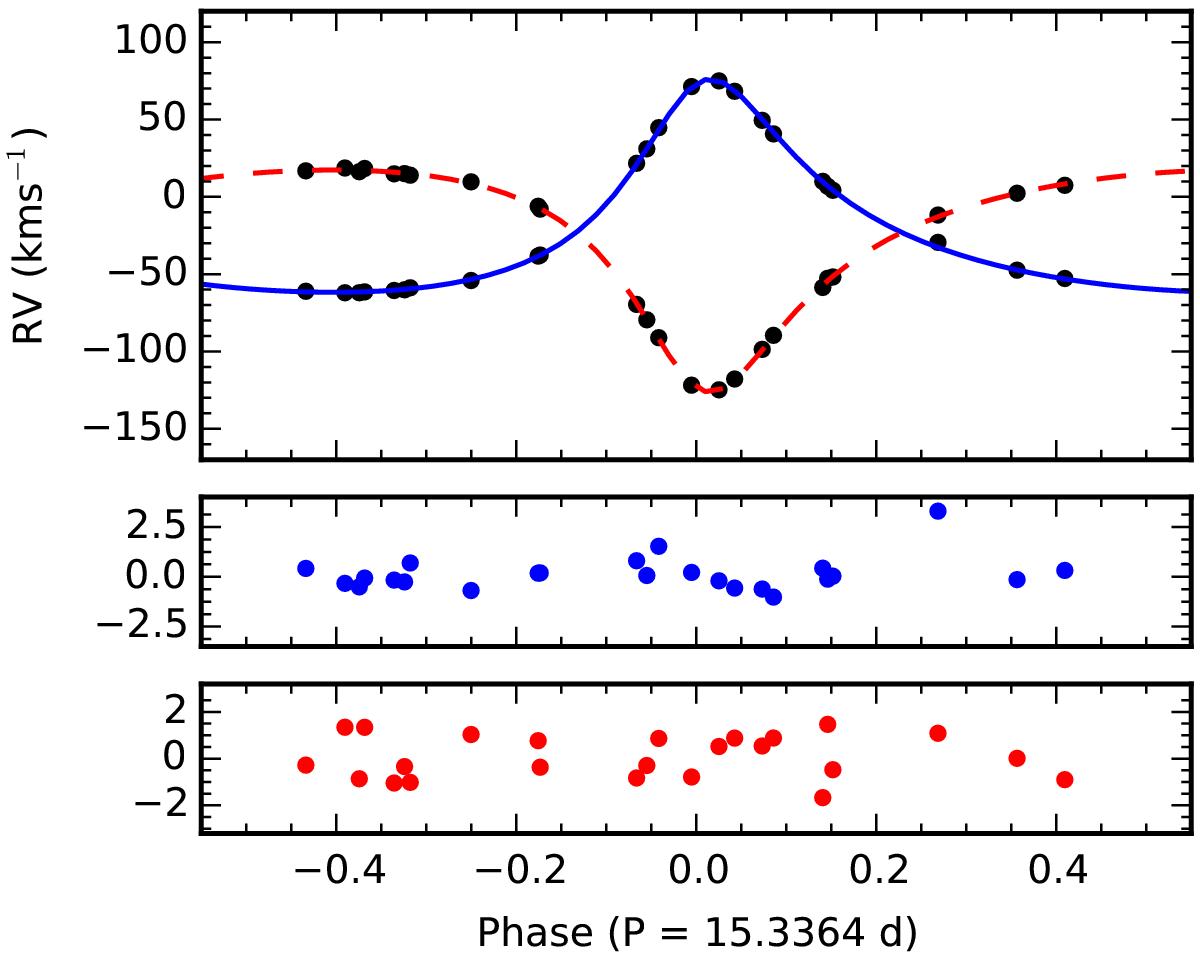
Top panel: radial velocities (black dots) of both components with the best fitting model for the primary (solid blue line) and the secondary (dashed red line). The residuals after subtracting the best fit are displayed for the primary in the middle panel and the secondary in the bottom panel. The error bars on each RV measurement are typically smaller than the symbol size.
Current usage metrics show cumulative count of Article Views (full-text article views including HTML views, PDF and ePub downloads, according to the available data) and Abstracts Views on Vision4Press platform.
Data correspond to usage on the plateform after 2015. The current usage metrics is available 48-96 hours after online publication and is updated daily on week days.
Initial download of the metrics may take a while.