Fig. 2
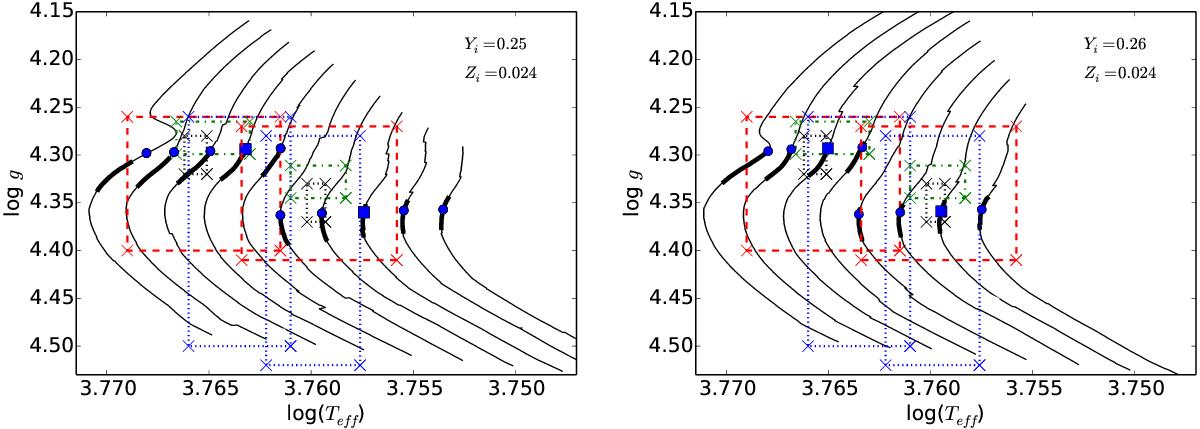
Evolutionary tracks for models from 1.05 to 1.14 M⊙ (from right to left) with Zi = 0.024 and Yi = 0.25 (left panel) and evolutionary tracks for models from 1.05 to 1.12 M⊙ (from right to left) with Zi = 0.024 and Yi = 0.26 (right panel). The error boxes are those of Ramírez et al. (2009; red dashed lines), Ramírez et al. (2011; green dot-dashed lines), Schuler et al. (2011; blue dotted lines) and Tucci Maia et al. (2014; black dotted lines). The blue dots indicate models with the right large separation, taking Kjeldsen et al. (2008) corrections into account. The blue squares correspond to models that also have the right small separations and best fit the Echelle diagram. The black thick segments of each line indicate the models whose radii are consistent with the interferometric determinations of White et al. (2013).
Current usage metrics show cumulative count of Article Views (full-text article views including HTML views, PDF and ePub downloads, according to the available data) and Abstracts Views on Vision4Press platform.
Data correspond to usage on the plateform after 2015. The current usage metrics is available 48-96 hours after online publication and is updated daily on week days.
Initial download of the metrics may take a while.