Fig. 9
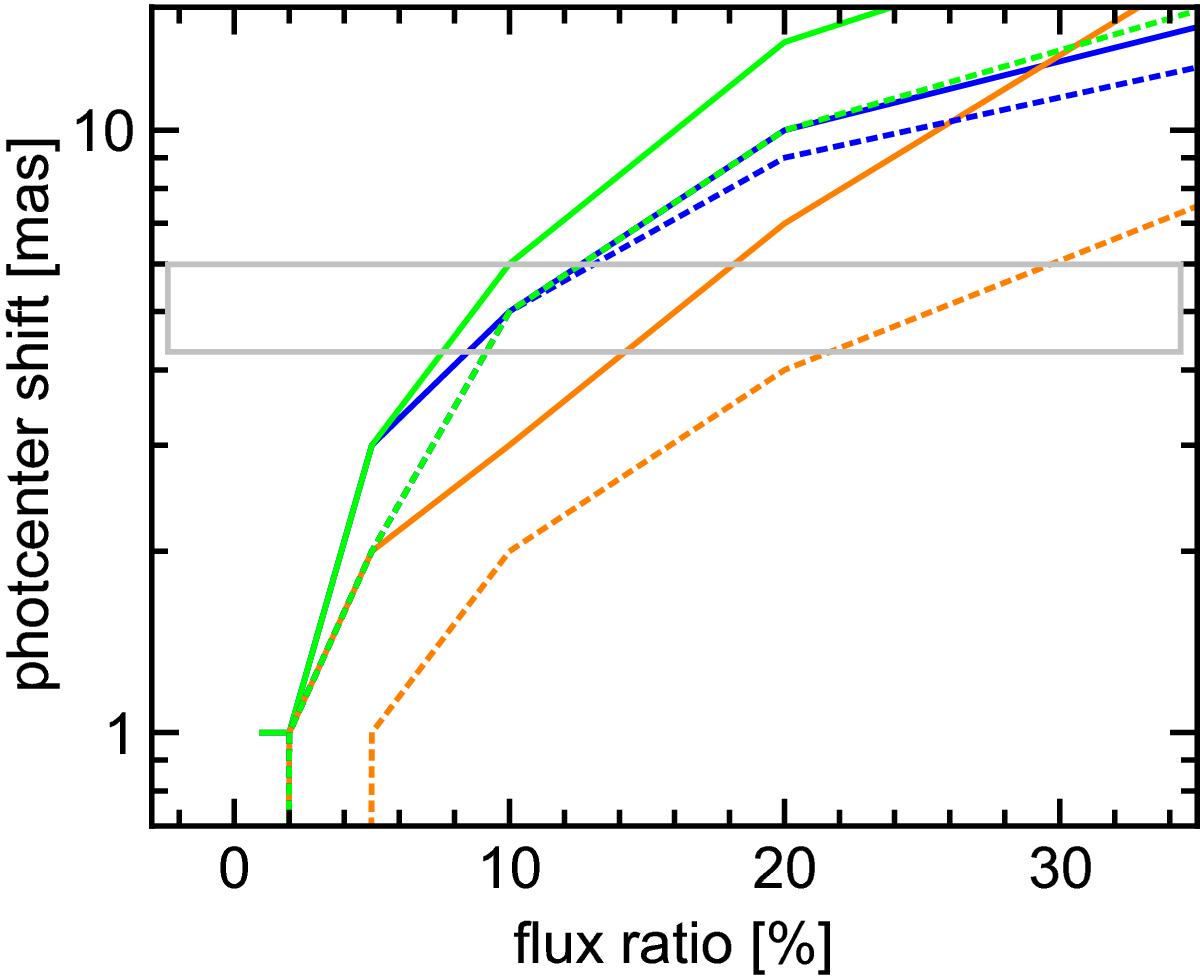
Photocentre shifts as predicted by the superposition of two Gaussian sources with different distance, flux ratio, and position angle (see text for details). The full and dashed lines correspond to PAs of 0° and 30°, respectively. The blue, green, and orange curves are for source distances of 70, 140, and 210 mas, respectively. The full rectangle indicates the range (mean ±1σ) of shifts in the blue components of the 13CO(1−0) lines in 2010.
Current usage metrics show cumulative count of Article Views (full-text article views including HTML views, PDF and ePub downloads, according to the available data) and Abstracts Views on Vision4Press platform.
Data correspond to usage on the plateform after 2015. The current usage metrics is available 48-96 hours after online publication and is updated daily on week days.
Initial download of the metrics may take a while.