Fig. 8
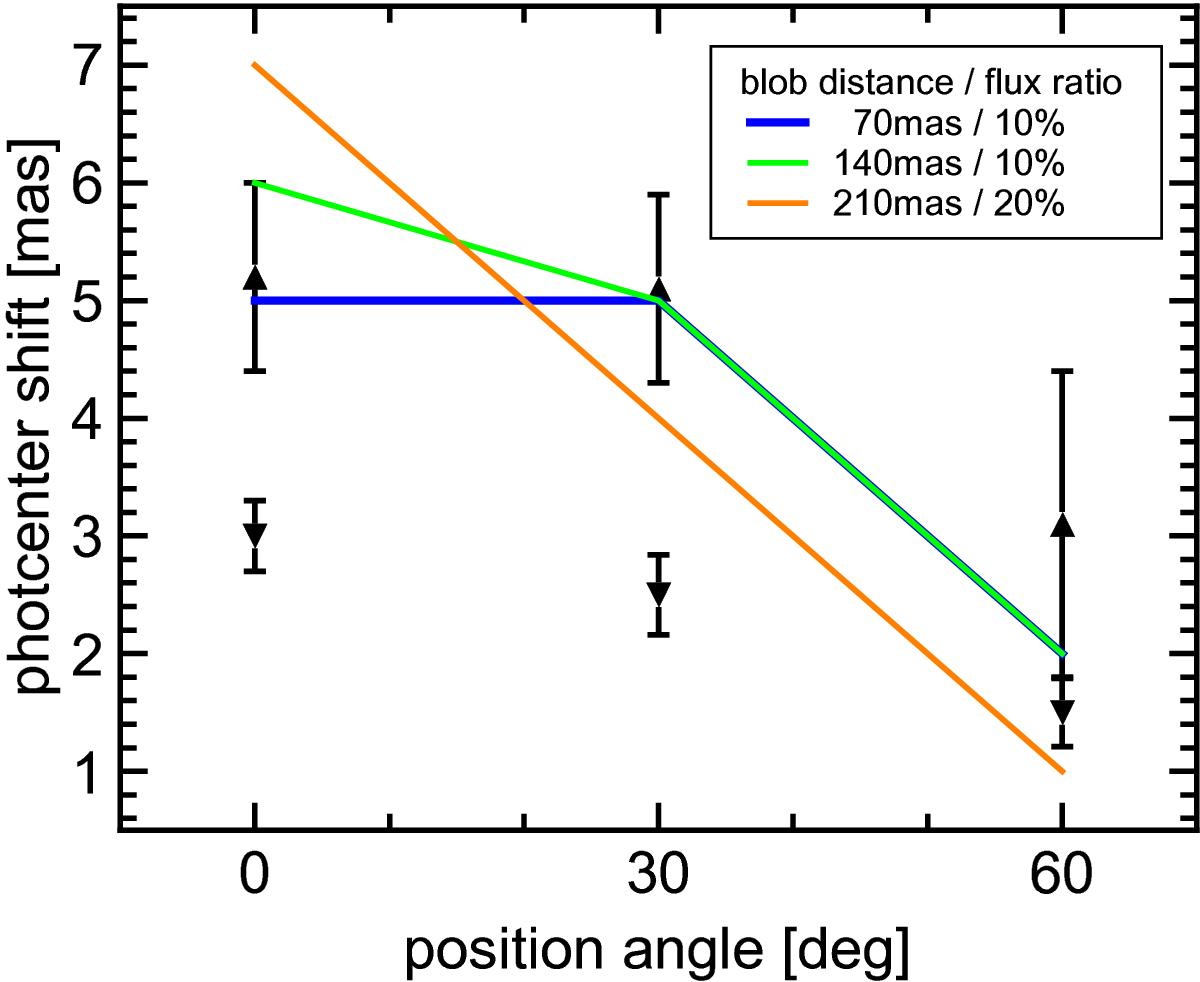
Mean photocentre shifts oin all used HCN lines versus PA. The PA = 90° data are not shown because their offset is not significantly different from zero. Up and down triangles give the measurements for the blue and red line component, respectively. The blue, green, and orange lines show the predictions from the simulations (see Sect. 5) for three different combinations of blob distance and flux ratio.
Current usage metrics show cumulative count of Article Views (full-text article views including HTML views, PDF and ePub downloads, according to the available data) and Abstracts Views on Vision4Press platform.
Data correspond to usage on the plateform after 2015. The current usage metrics is available 48-96 hours after online publication and is updated daily on week days.
Initial download of the metrics may take a while.