Fig. 7
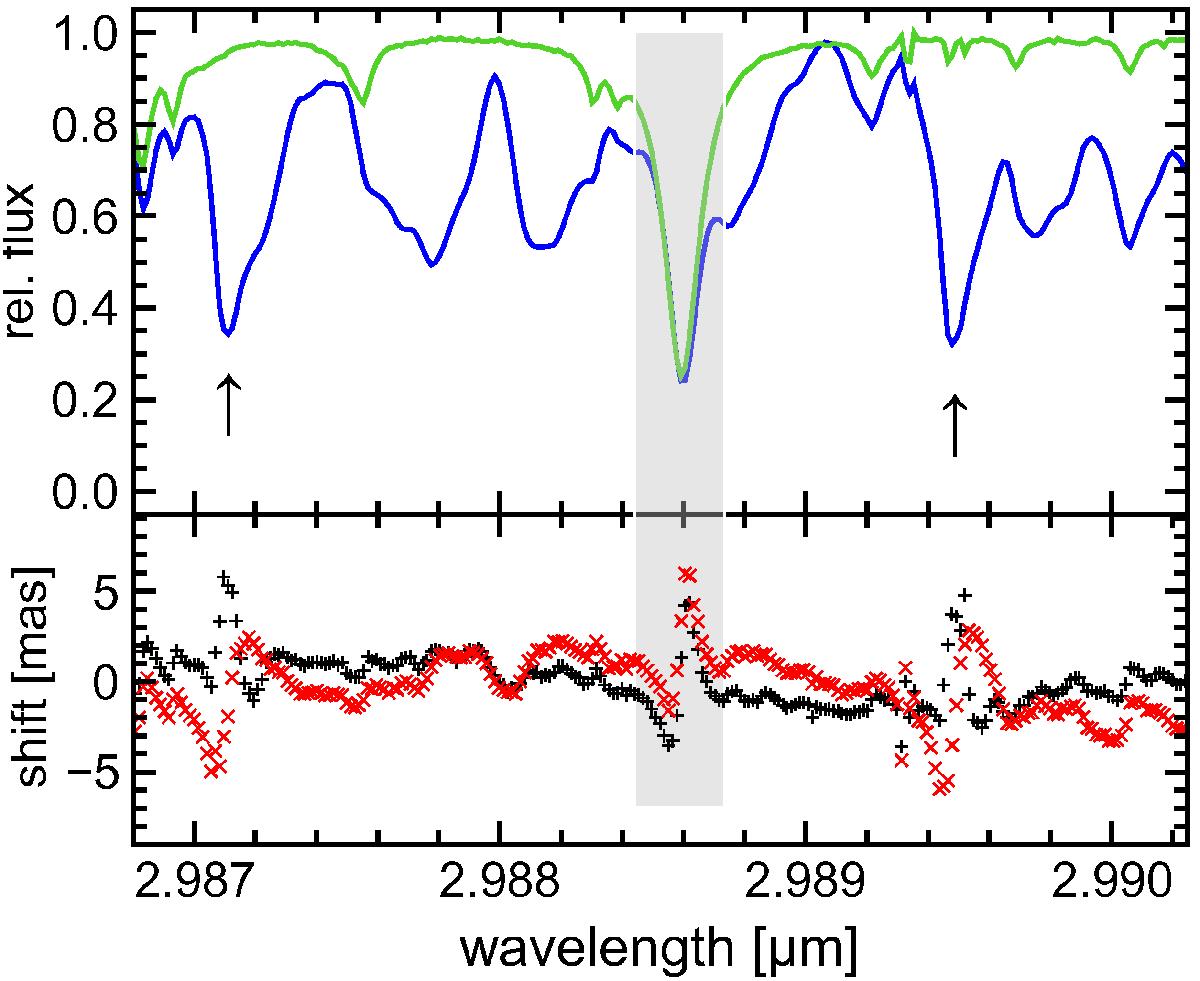
Flux and position spectra in 2010 near 2.98 μm. The blue curve is the flux spectrum of TX Psc, and the green curve is the spectrum of the early type standard HIP 116928. The arrows identify the HCN lines used in the analysis, the grey rectangles indicate regions affected by telluric absorption. The plus signs and crosses correspond to the position spectra at PAs of 0° and 180°, respectively. We note again the tilde-shaped profiles in the position spectra of the stellar HCN lines.
Current usage metrics show cumulative count of Article Views (full-text article views including HTML views, PDF and ePub downloads, according to the available data) and Abstracts Views on Vision4Press platform.
Data correspond to usage on the plateform after 2015. The current usage metrics is available 48-96 hours after online publication and is updated daily on week days.
Initial download of the metrics may take a while.