Free Access
Fig. 6
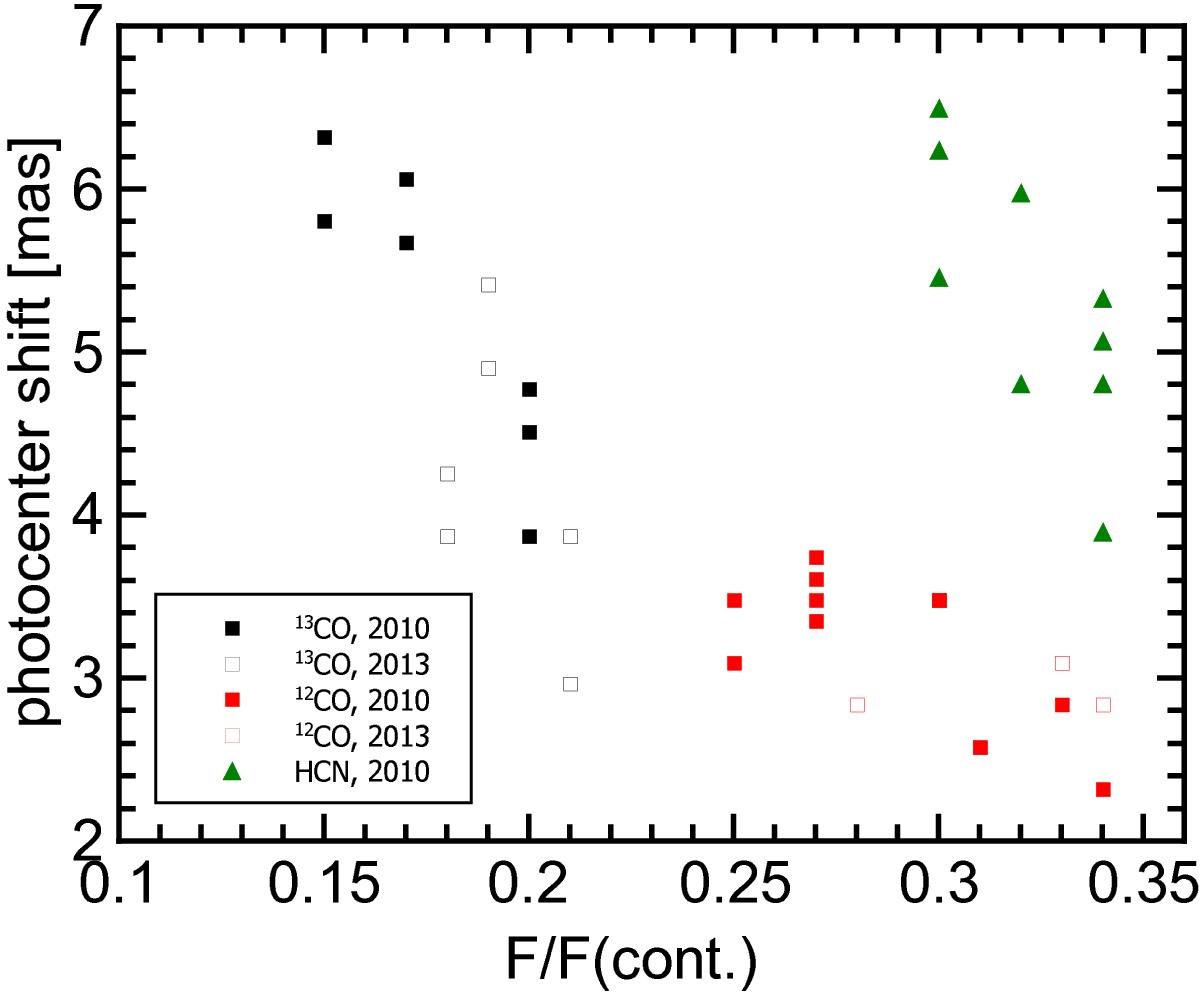
Photocentre shifts of the blue components of all used CO and HCN lines for PA = 0° versus line depth. Colours as in Fig. 4 for the CO lines. Green triangles refer to the HCN lines. Full and open squares denote the 2010 and 2013 CO data, respectively. For each line, the shifts of both nodding positions are plotted.
Current usage metrics show cumulative count of Article Views (full-text article views including HTML views, PDF and ePub downloads, according to the available data) and Abstracts Views on Vision4Press platform.
Data correspond to usage on the plateform after 2015. The current usage metrics is available 48-96 hours after online publication and is updated daily on week days.
Initial download of the metrics may take a while.