Fig. 4
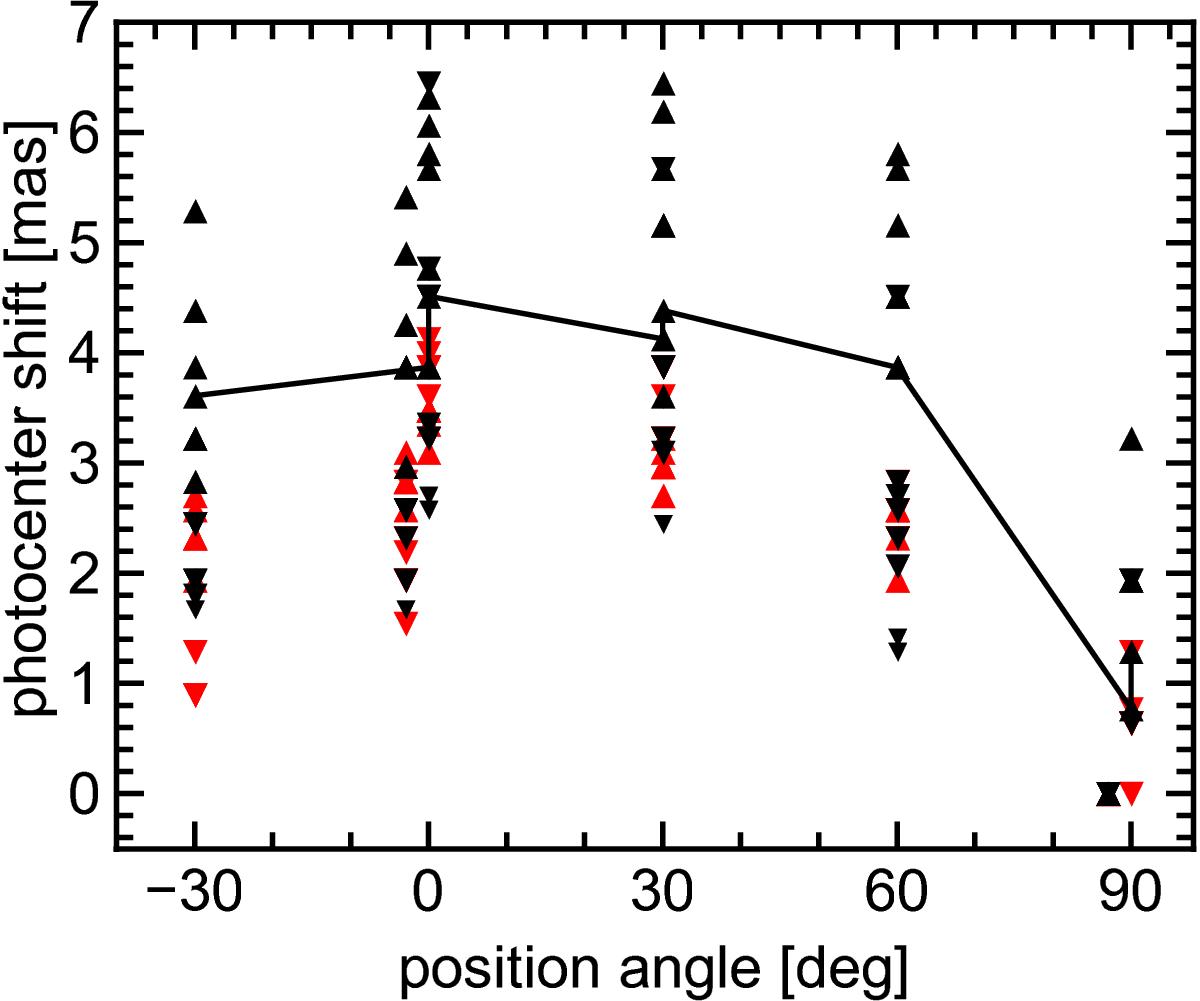
Photocentre shifts of all used CO lines versus PA. Black and red symbols refer to 13CO(1−0) and 12CO(2−1) lines, respectively. Up and down triangles give the measurements for the blue and red line components, respectively. For each line and PA, two measurements are plotted corresponding to the two nodded spectra. The data for the 13CO(1−0)R21 line are connected by a line to guide the eye. The PA = 0° and 90° data of 2013 have been offset in PA by −3° for clarity. The PA = −60° data are not shown because their offset is not significantly different from zero.
Current usage metrics show cumulative count of Article Views (full-text article views including HTML views, PDF and ePub downloads, according to the available data) and Abstracts Views on Vision4Press platform.
Data correspond to usage on the plateform after 2015. The current usage metrics is available 48-96 hours after online publication and is updated daily on week days.
Initial download of the metrics may take a while.