Fig. 2
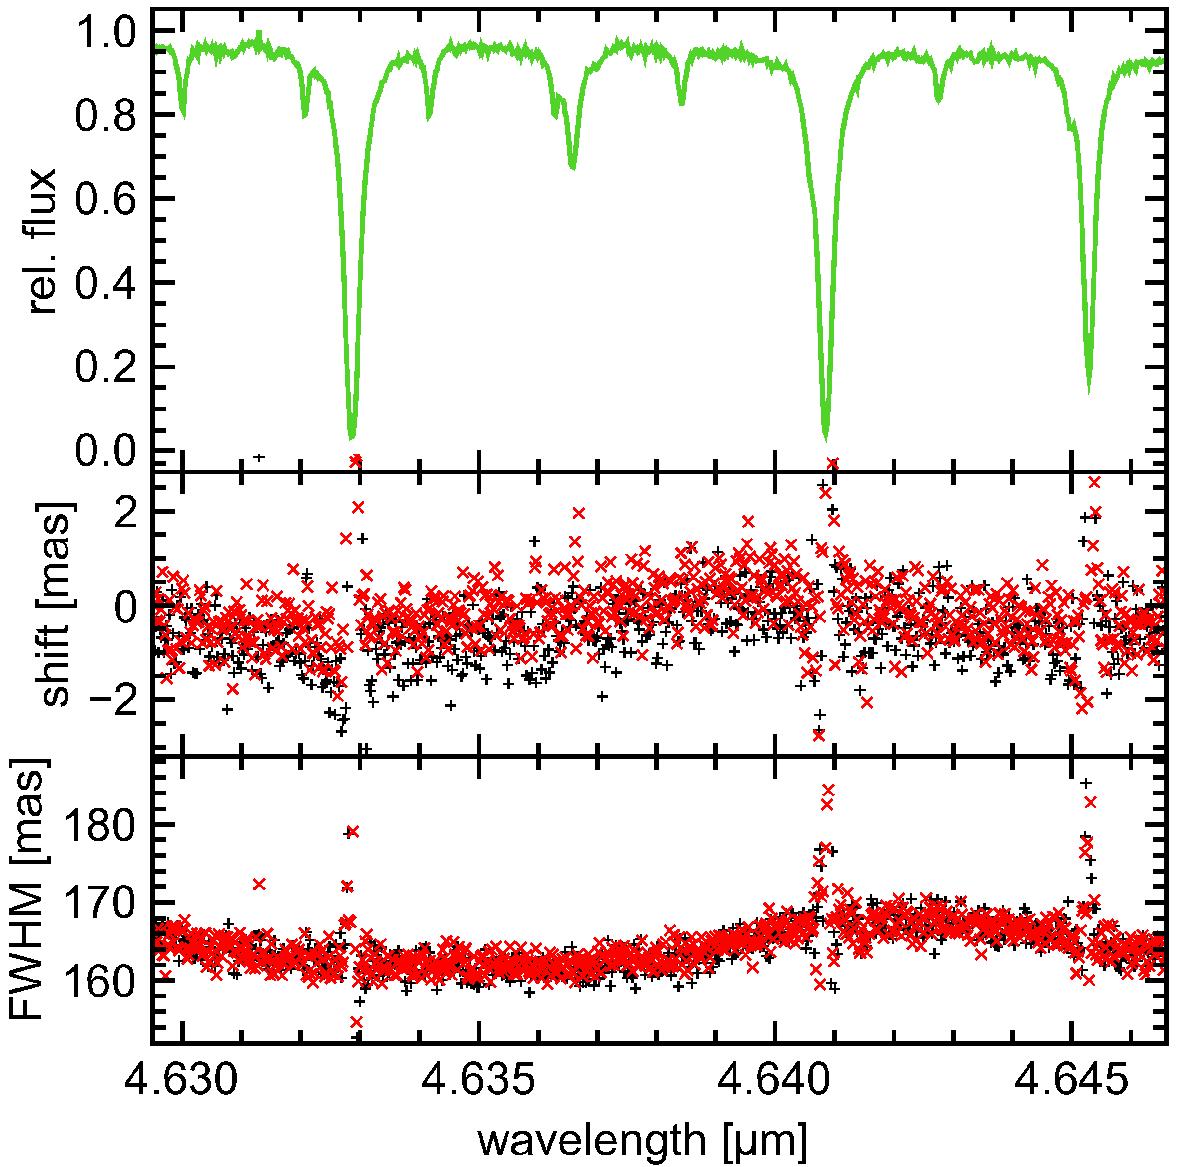
Example 2010 data for the early type standard HIP 116928 in the M band. The uppermost panel shows the normalized flux spectrum. The middle and lower panels are the position and FWHM spectra resulting from the Gauss fits, respectively. For the position spectra, a global trend was subtracted (see text). The plus signs and crosses correspond to the data at PAs of 0° and 180°, respectively.
Current usage metrics show cumulative count of Article Views (full-text article views including HTML views, PDF and ePub downloads, according to the available data) and Abstracts Views on Vision4Press platform.
Data correspond to usage on the plateform after 2015. The current usage metrics is available 48-96 hours after online publication and is updated daily on week days.
Initial download of the metrics may take a while.