Fig. 10
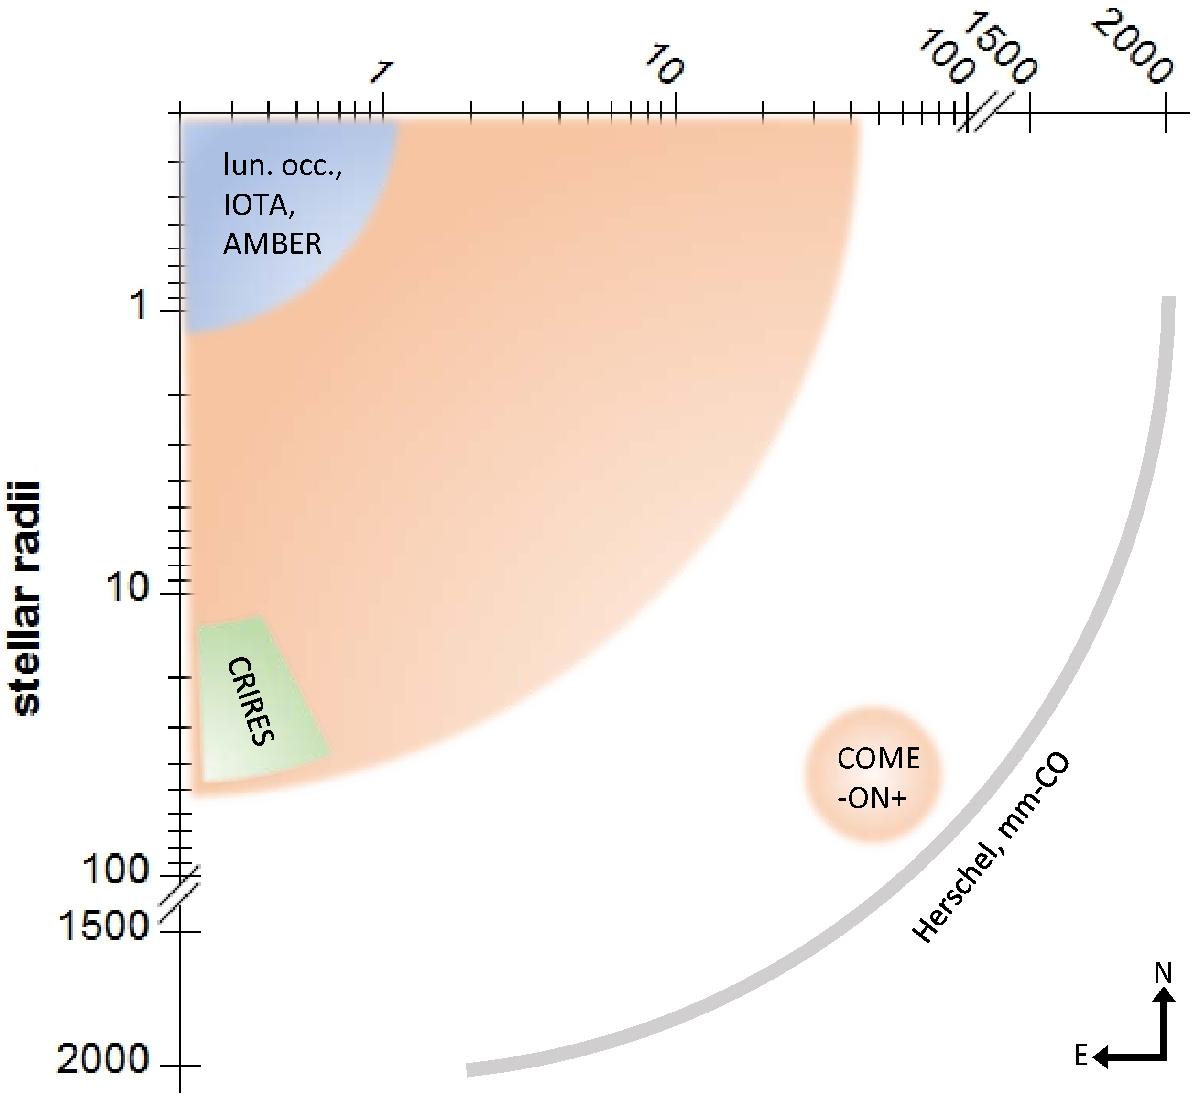
Sketch of the environment of TX Psc (see also Sect. 2). In the blue region, interferometric methods found asymmetries in various directions at scales up to the stellar radius. The orange regions show the structures observed by Cruzalèbes et al. (1998), the grey shell indicates the far-IR observations and the green region marks the blob detected in this work. Note the logarithmic scale! A stellar radius of 5 mas was adopted.
Current usage metrics show cumulative count of Article Views (full-text article views including HTML views, PDF and ePub downloads, according to the available data) and Abstracts Views on Vision4Press platform.
Data correspond to usage on the plateform after 2015. The current usage metrics is available 48-96 hours after online publication and is updated daily on week days.
Initial download of the metrics may take a while.