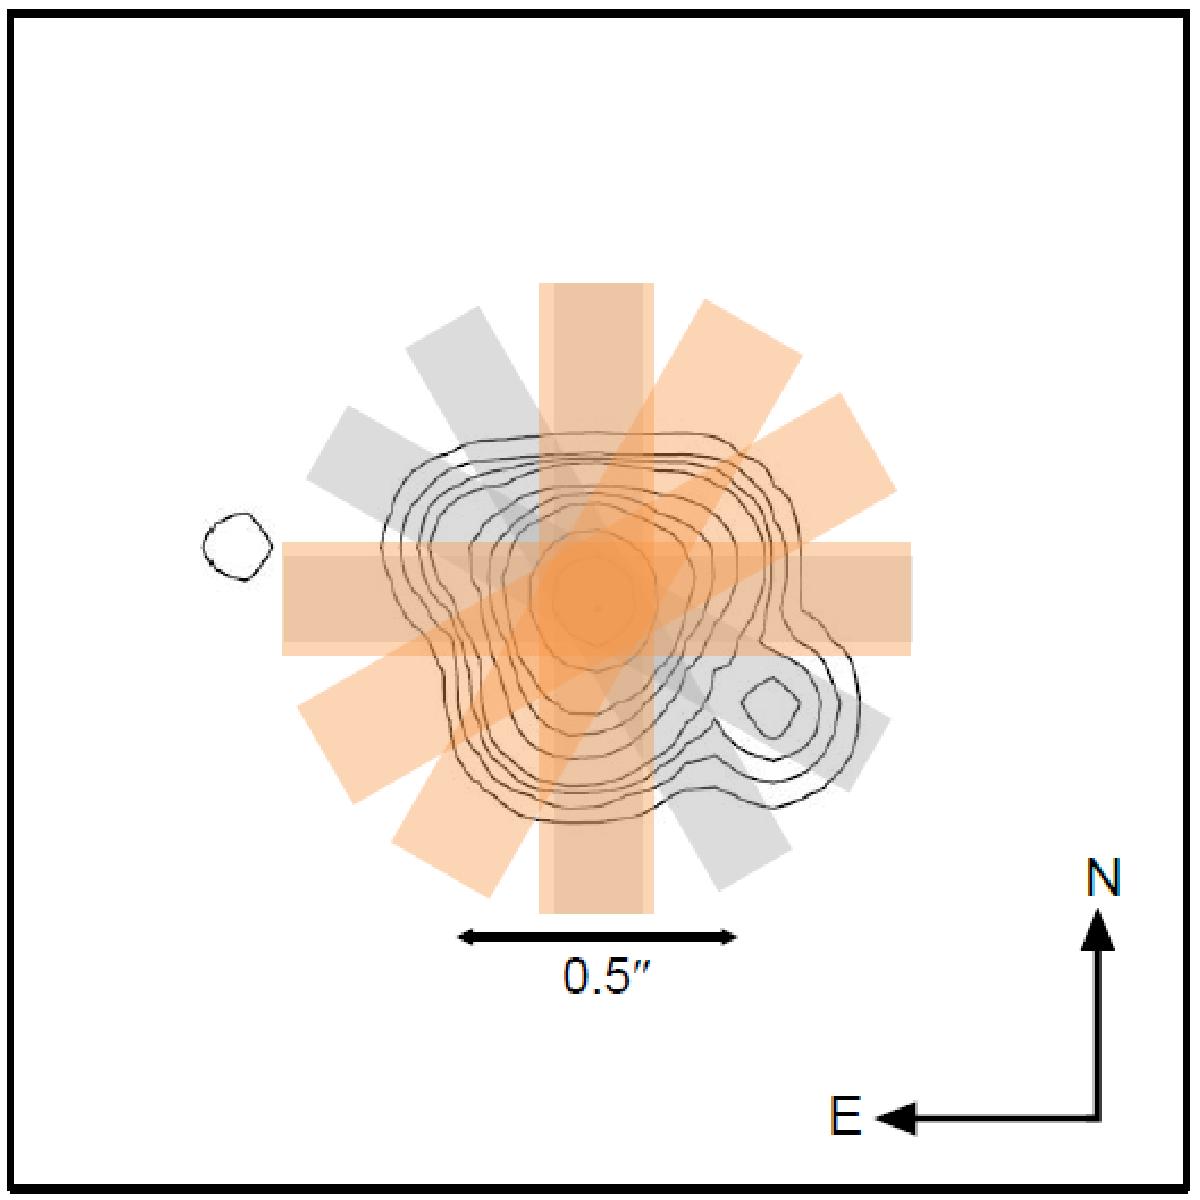
Fig. 1

Reconstructed map of TX Psc in the K band from Cruzalèbes et al. (1998) with the CRIRES slit positions used superposed. The FWHM of the NACO beam was 0.15′′.The width of the rectangles roughly corresponds to the slit widths used. The NE/SW quadrants were observed in 2010 (grey rectangles), the NW/SE quadrants in 2013 (orange). PAs of 0° and 90° were observed in both runs. The outermost four contours correspond to 0.1, 0.3, 0.6, and 1% of the central flux.
Current usage metrics show cumulative count of Article Views (full-text article views including HTML views, PDF and ePub downloads, according to the available data) and Abstracts Views on Vision4Press platform.
Data correspond to usage on the plateform after 2015. The current usage metrics is available 48-96 hours after online publication and is updated daily on week days.
Initial download of the metrics may take a while.


