Fig. 1
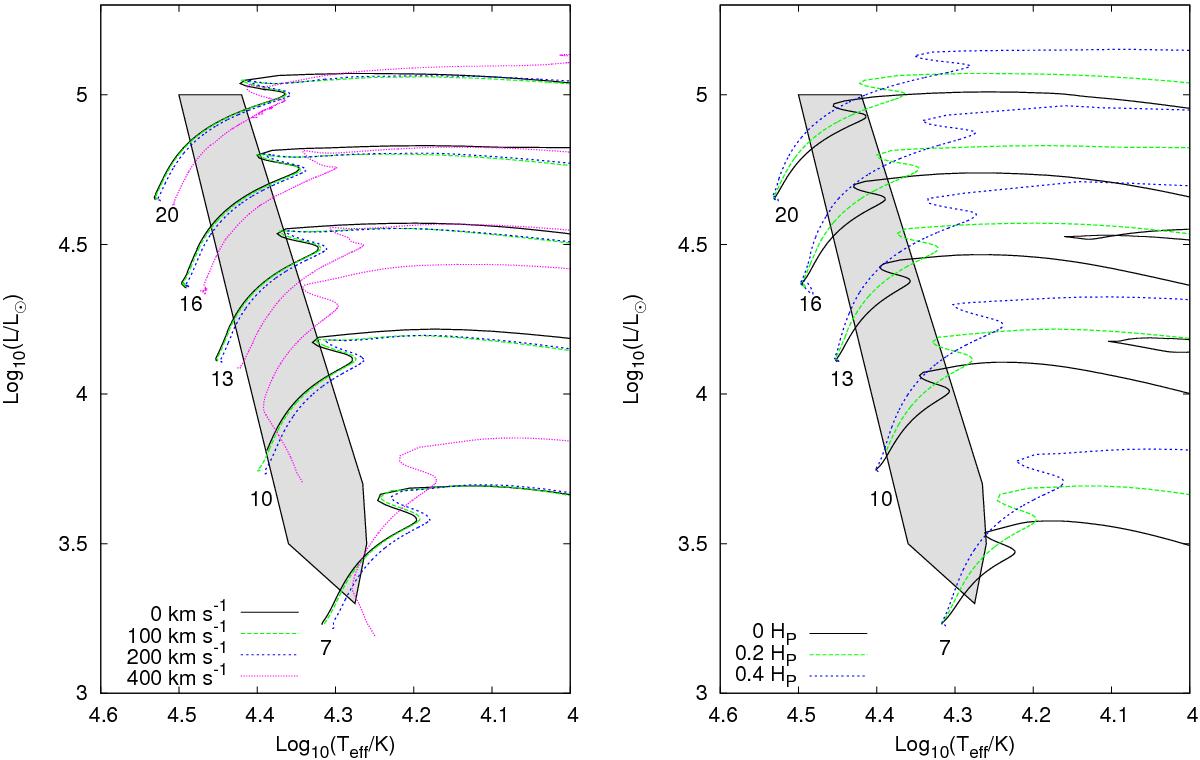
Left: stellar evolution tracks assuming moderate convective core overshoot, αc = 0.2 and initial rotation rates of 0,100,200, and 400 km s-1 denoted by black solid, green dashed, blue dot-dashed, and magenta dotted lines, respectively. Right: stellar evolution tracks assuming zero rotation and convective core overshoot, αc = 0,0.2, and 0.4 as denoted by black solid, green dashed, and blue dot-dashed lines, respectively.
Current usage metrics show cumulative count of Article Views (full-text article views including HTML views, PDF and ePub downloads, according to the available data) and Abstracts Views on Vision4Press platform.
Data correspond to usage on the plateform after 2015. The current usage metrics is available 48-96 hours after online publication and is updated daily on week days.
Initial download of the metrics may take a while.