Fig. 2
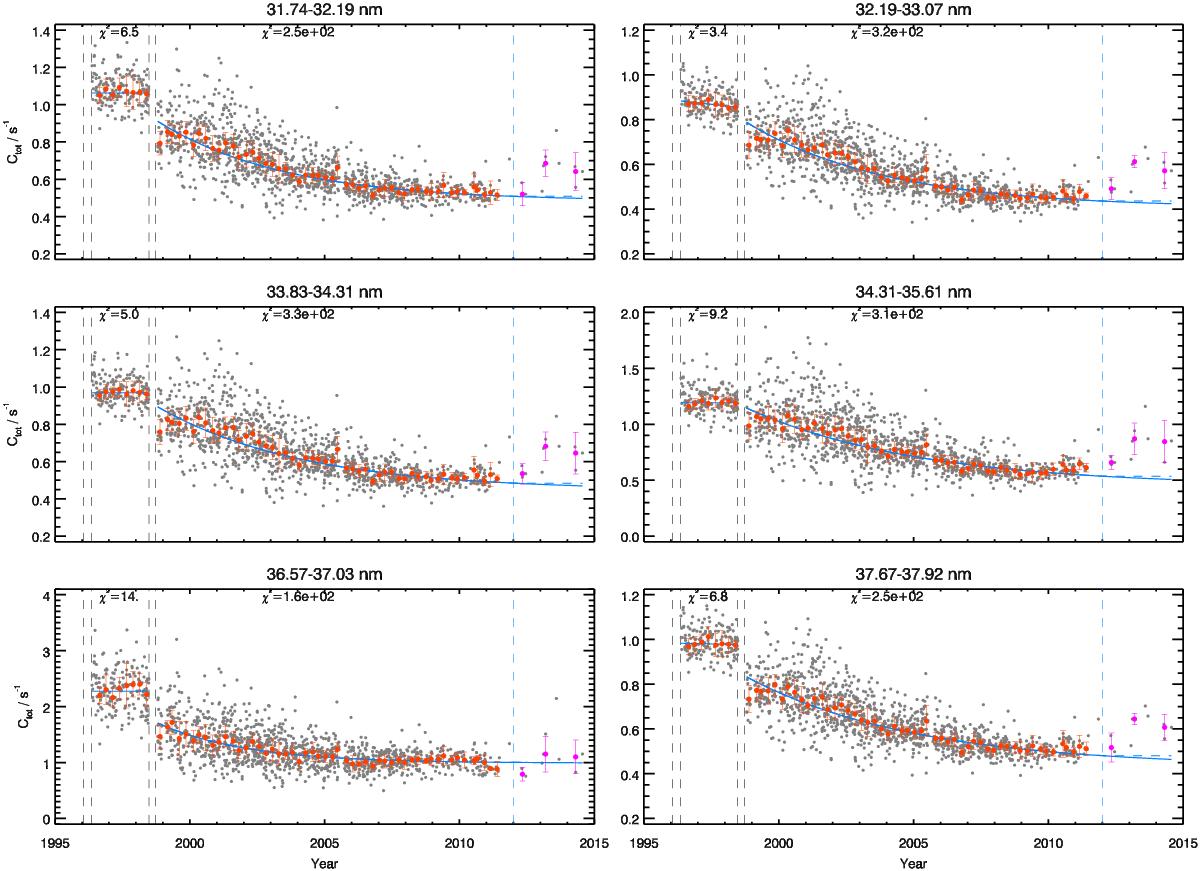
Time dependence of average radiances (units are photon-events per second) in various wavelength bins from the NIMCP 90′′ quiet Sun observations in selected NIS 1 wavelength bins. The vertical black dashed lines mark: the first VDS exposure (January 1996), the first NIMCP data set analysed (May 1996; taken as reference for our subsequent analysis), the date of loss of contact with SOHO (June 1998), and the return of SOHO to its normal mode (September 1998). The blue dashed vertical line is the upper limit for the data used for the fit. The radiances of the individual NIMCP data files are shown as grey dots. The 90-day binned data are shown in red. The most recent data (not used for the fit) are shown in magenta. The solid blue line is the fit, while the dashed blue line after 2012 shows the “saturated level”.
Current usage metrics show cumulative count of Article Views (full-text article views including HTML views, PDF and ePub downloads, according to the available data) and Abstracts Views on Vision4Press platform.
Data correspond to usage on the plateform after 2015. The current usage metrics is available 48-96 hours after online publication and is updated daily on week days.
Initial download of the metrics may take a while.