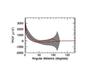
Fig. 8
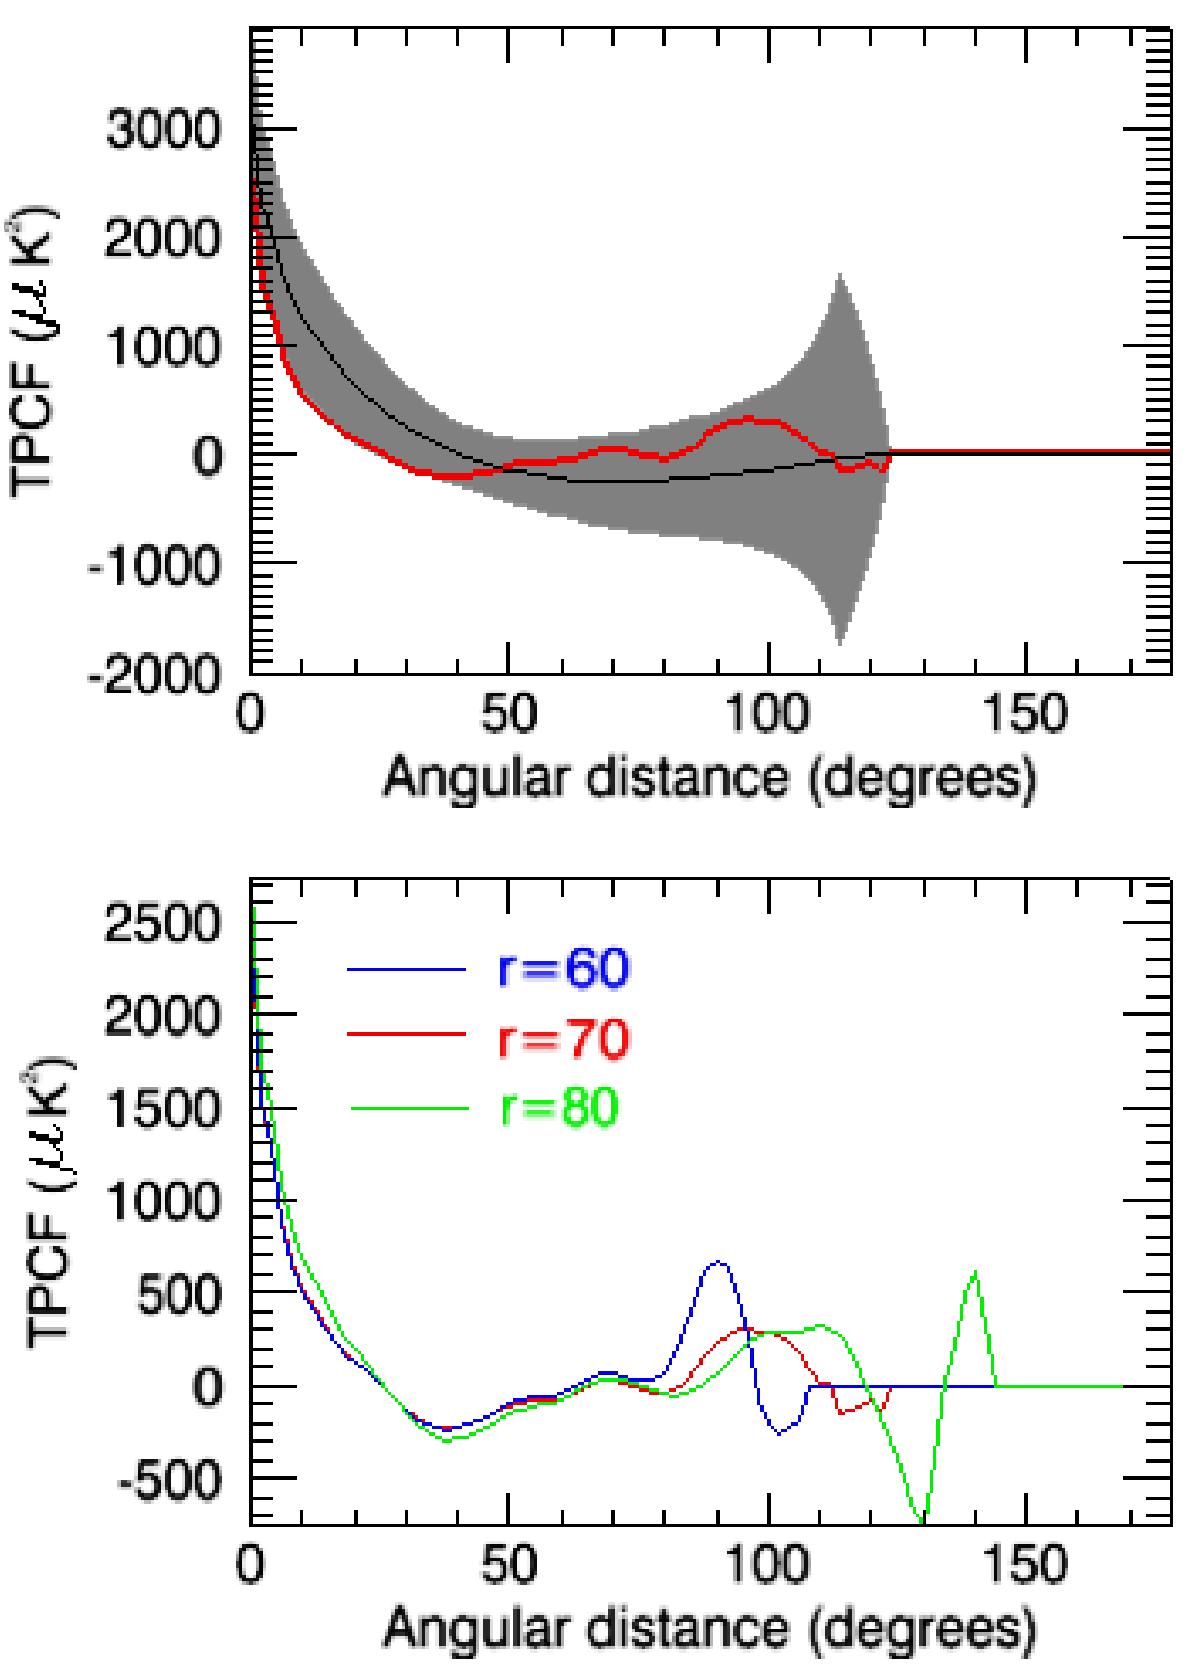
Top: TPCF curve computed for SMICA2 (red curve) using mask-rulerminimal in a circular region centered at (φ,θ) = (225°,45°) and radius, r = 70°. The shadow part depicts the standard deviation intervals (68% C.L) for 1000 simulated maps produced with the ΛCDM spectrum. The black curve is the mean TPCF considering the MC simulated maps. Bottom: TPCF computed for SMICA2 using mask-rulerminimal in a circular region centered at (φ,θ) = (225°,45°) and radius, r = 60°,70° and 80°.
Current usage metrics show cumulative count of Article Views (full-text article views including HTML views, PDF and ePub downloads, according to the available data) and Abstracts Views on Vision4Press platform.
Data correspond to usage on the plateform after 2015. The current usage metrics is available 48-96 hours after online publication and is updated daily on week days.
Initial download of the metrics may take a while.