Fig. 1
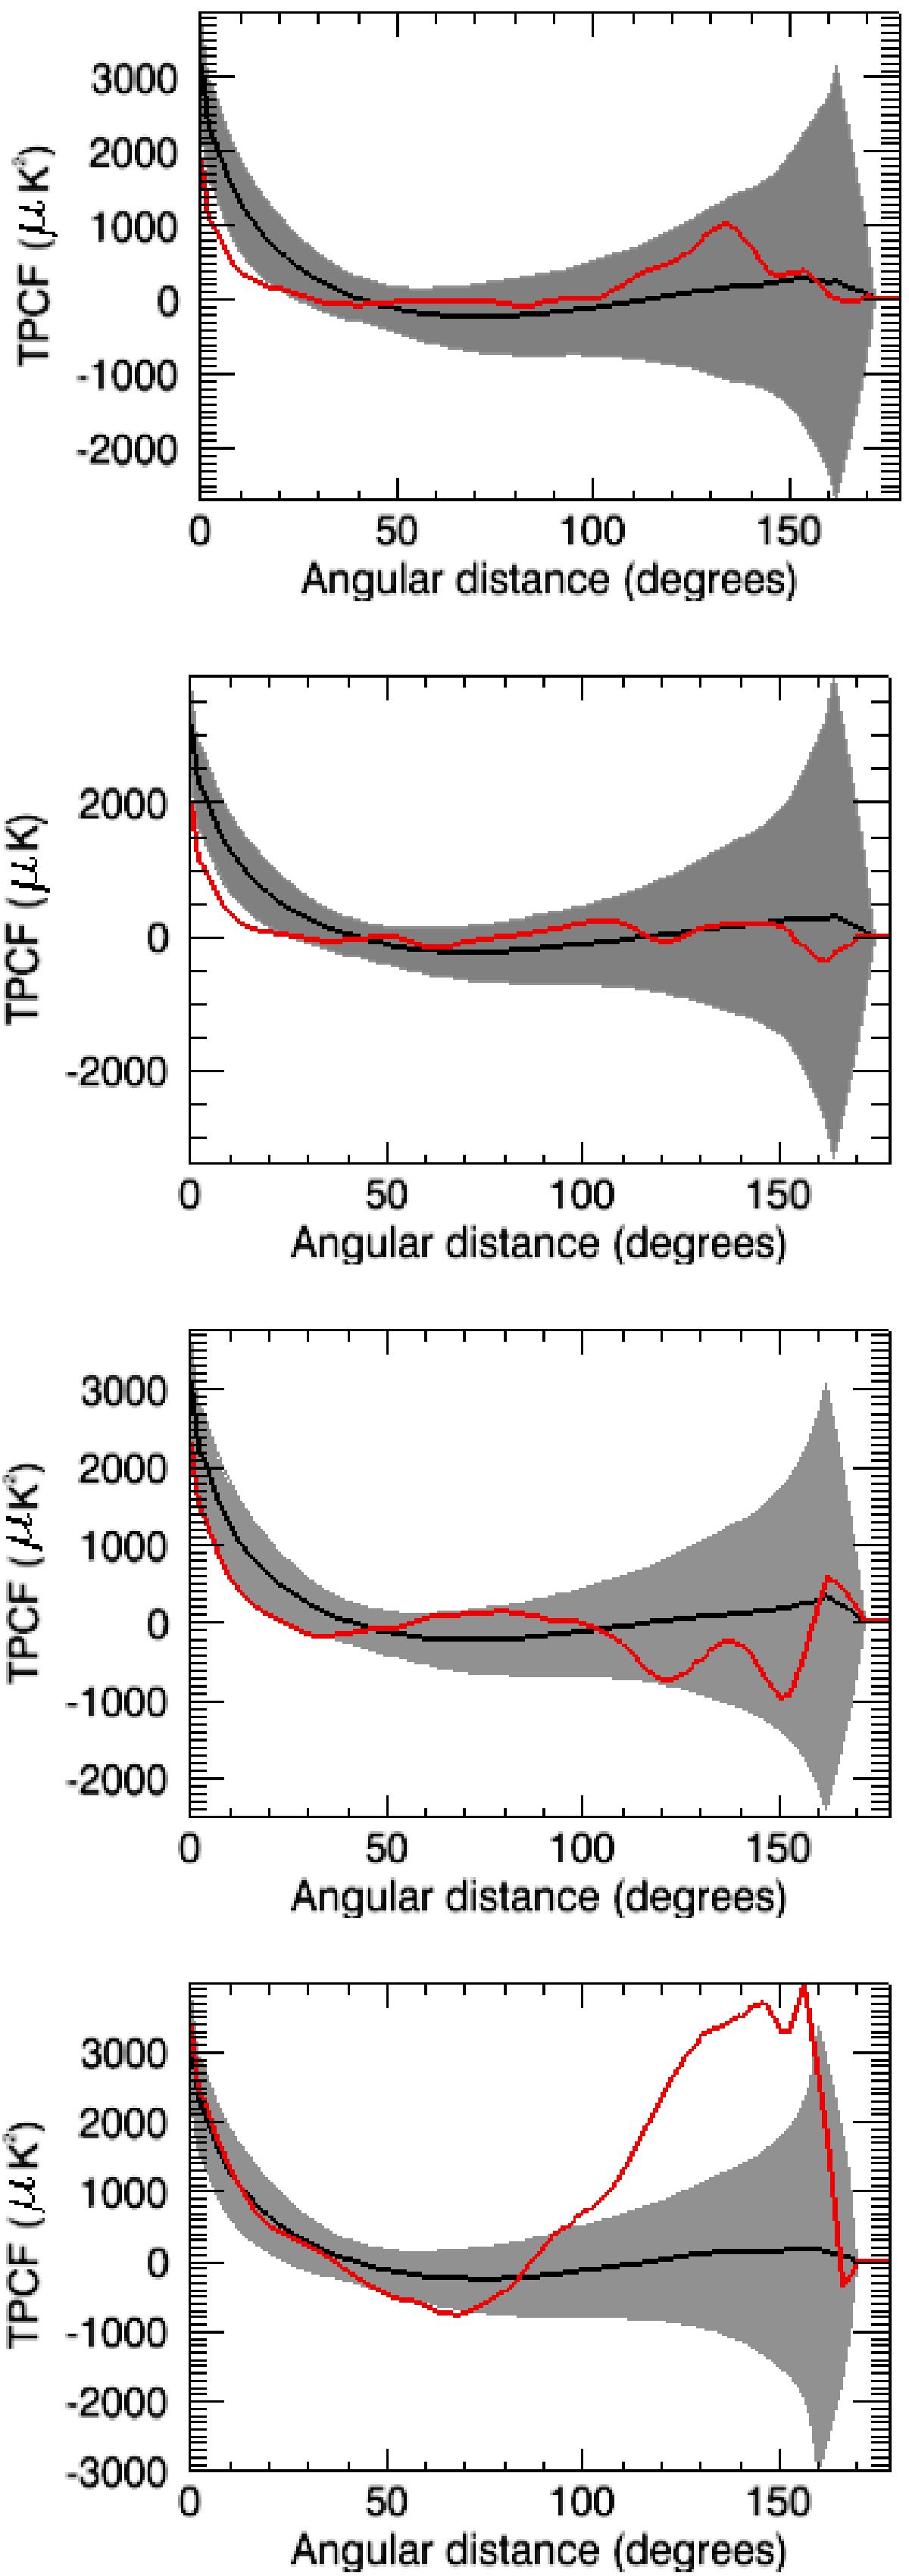
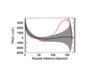
TPCF curves computed for the main Planck second data release temperature foreground-cleaned map (SMICA2) (red curve) using mask-rulerminimal. We smoothed the curves using the smooth function from Interactive Data Language (IDL) for illustration purposes only (in the calculations we use the original calculated values for the TPCF). From top to bottom, NWQ, NEQ, SWQ, and SEQ appear as solid red lines. The shadow part depicts the standard deviation intervals (68% C.L) for 1000 simulated maps produced with the ΛCDM spectrum. The black curve is the mean TPCF considering the MC simulated maps.
Current usage metrics show cumulative count of Article Views (full-text article views including HTML views, PDF and ePub downloads, according to the available data) and Abstracts Views on Vision4Press platform.
Data correspond to usage on the plateform after 2015. The current usage metrics is available 48-96 hours after online publication and is updated daily on week days.
Initial download of the metrics may take a while.