Fig. 4
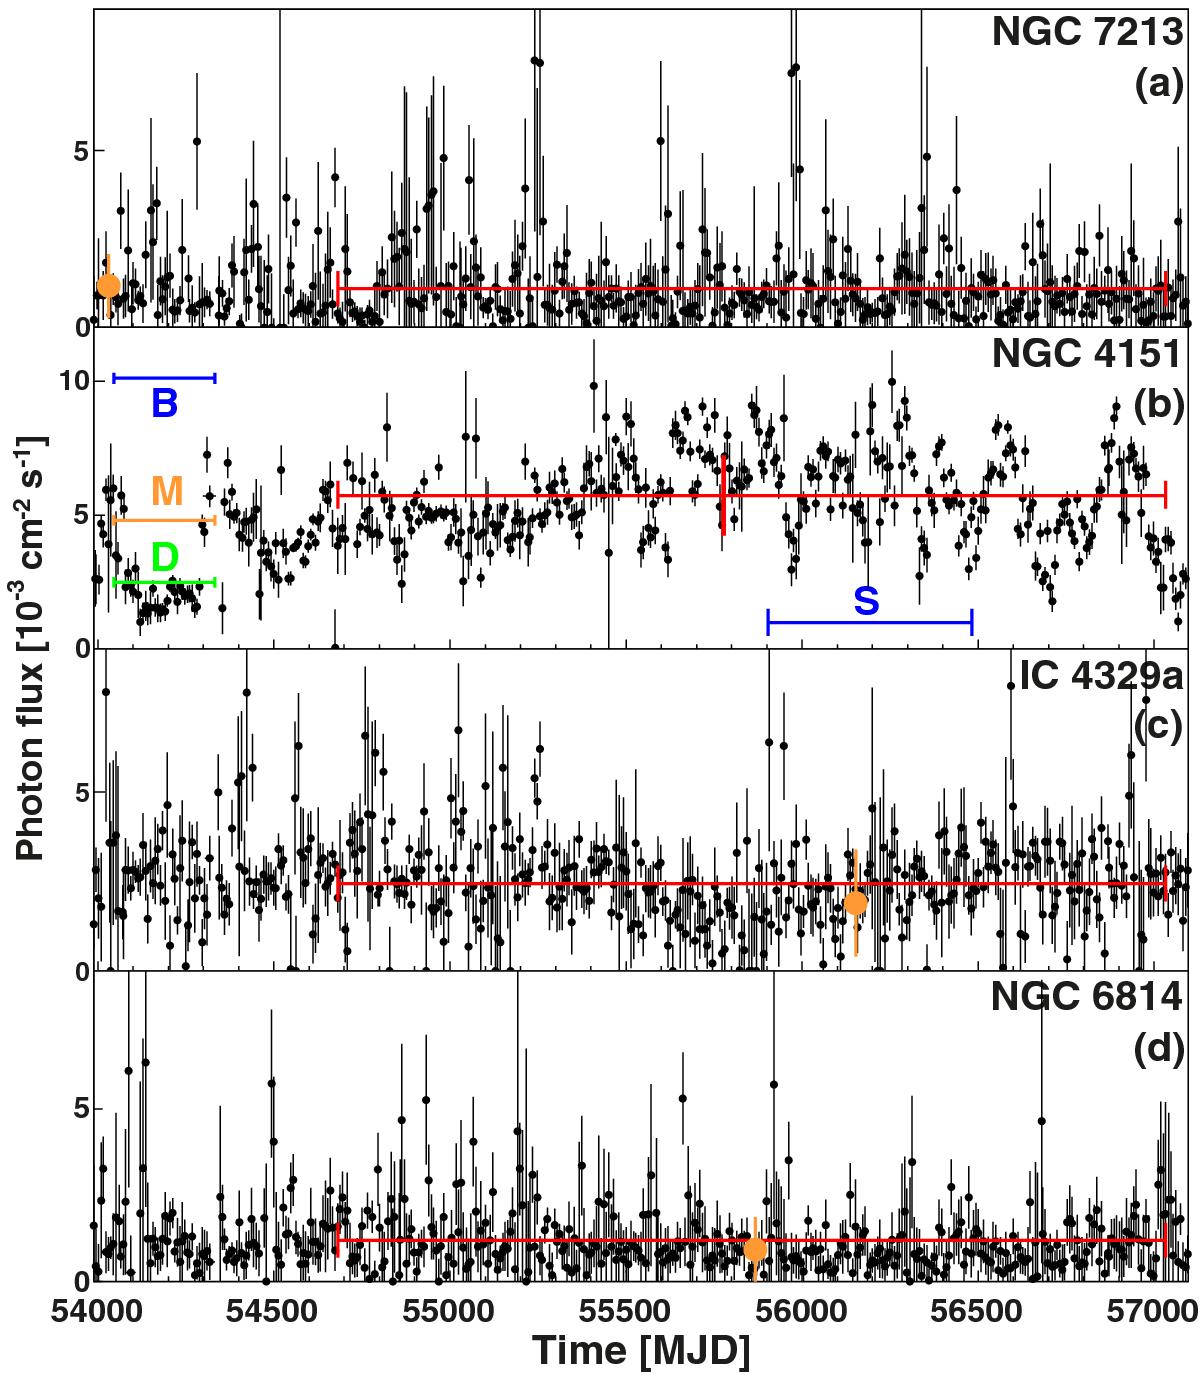
Small black circles with error bars show Swift/BAT 15–50 keV light curves in seven-day bins for NGC 7213, NGC 4151, IC 4329a, and NGC 6814. The red vertical line in each panel shows the average flux during the 6.4 years of analyzed Fermi/LAT observations. The large orange circles in panels (a) c) d)) show the times of the adopted Suzaku and NuStar observations and the average flux in time bins equal to the duration of these pointing observations. The red vertical line in panel b) indicates the end of the three-year period used for comparison with Ackermann et al. (2012a). The blue line in the bottom of panel b) delineates period S (see Sect. 3.2). The flux levels of dim (D), medium (M), and bright (B) states, defined in Lubiński et al. (2010), are shown in the left part of panel b).
Current usage metrics show cumulative count of Article Views (full-text article views including HTML views, PDF and ePub downloads, according to the available data) and Abstracts Views on Vision4Press platform.
Data correspond to usage on the plateform after 2015. The current usage metrics is available 48-96 hours after online publication and is updated daily on week days.
Initial download of the metrics may take a while.