Fig. 1
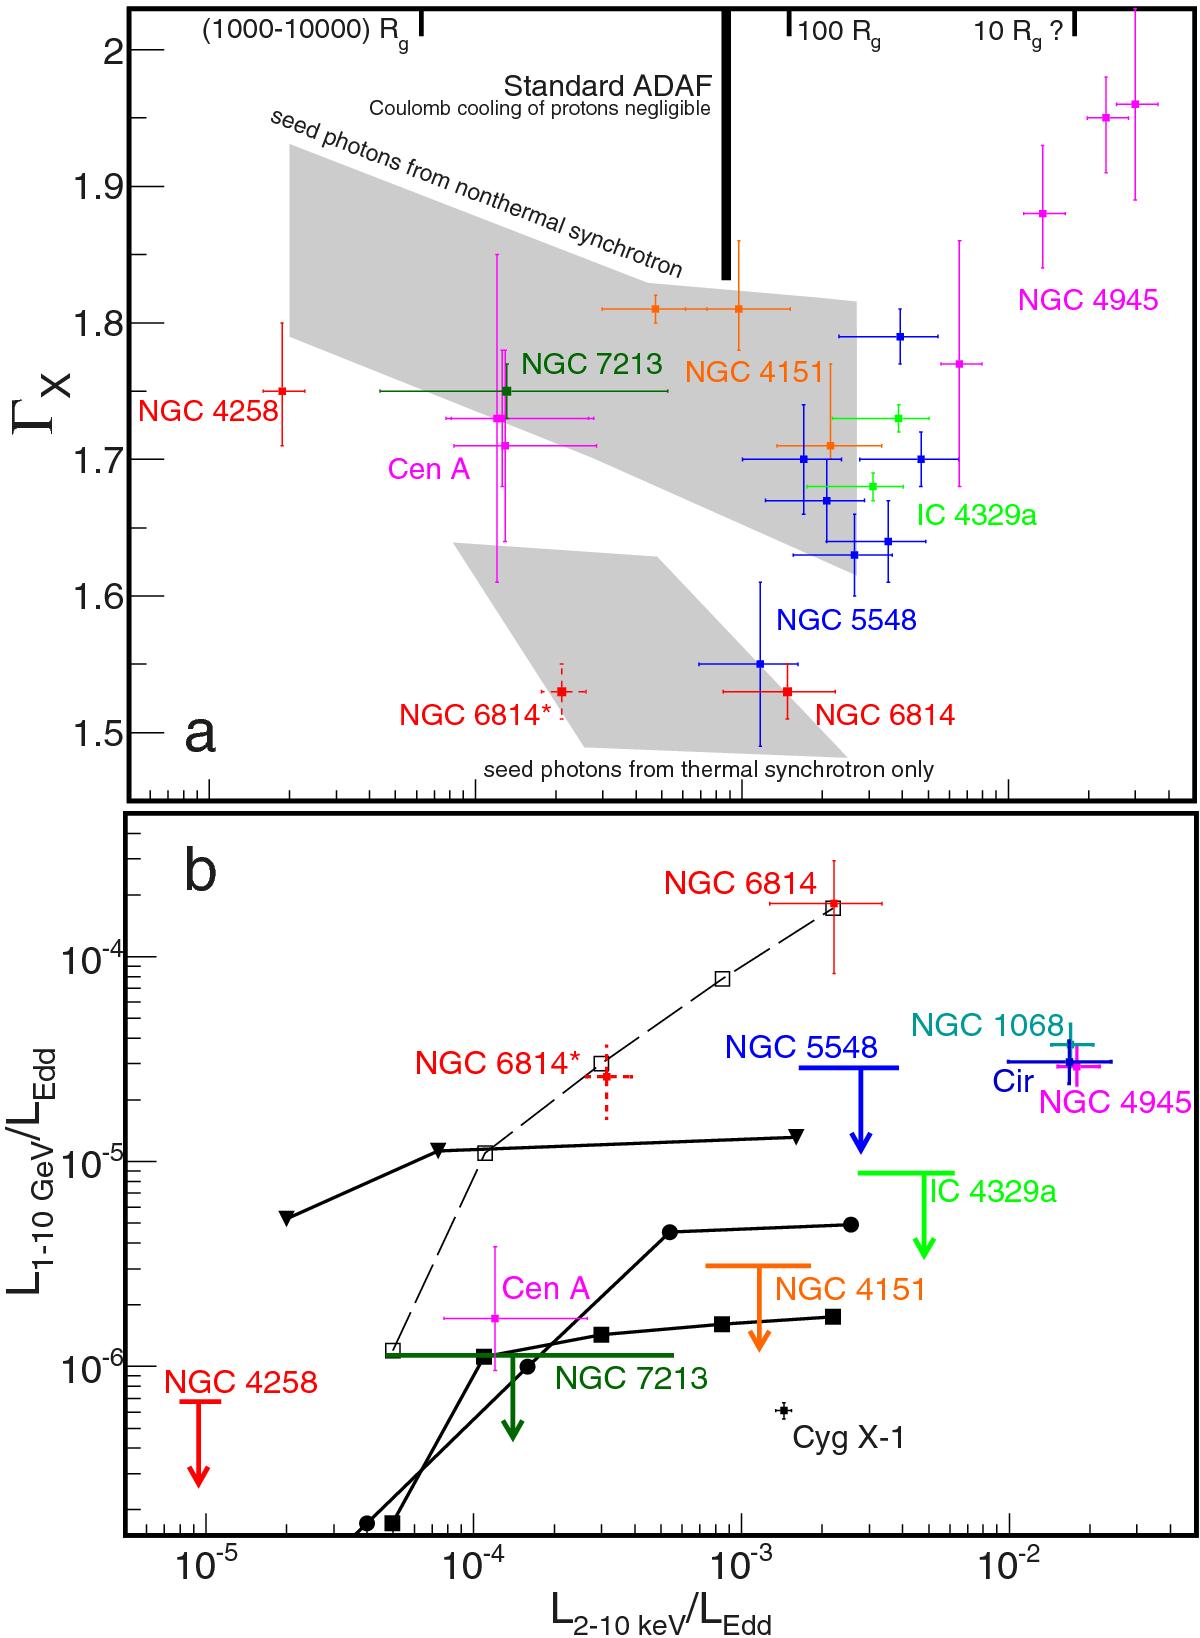
a) X-ray photon spectral index as a function of intrinsic λ2−10keV. The observational data correspond to the best fits of the high-quality observations described in Sect. 3. The gray regions indicate the location of solutions for the model with seed photons from thermal synchrotron only lower and including nonthermal synchrotron (of pion-decay or directly accelerated electrons; upper region). Ticks in the top axis show the approximate value of rtr (see text). The thick vertical line indicates the maximum luminosity for the standard ADAF solutions (i.e., unaffected by the Coulomb cooling of protons). b) λ1−10GeV as a function of λ2−10keV, see Tables 1 and 2 for the observational data. The solid lines are for model N with δ = 10-3, a = 0.95, β = 9 (triangles), model N with δ = 0.5, a = 0, β = 9 is plotted with circles), model H0.1 with δ = 10-3, a = 0.95, β = 9 with squares, and all three are the same as in Fig. 2b below. The dashed line with open squares denotes the rest-frame 1–10GeV luminosity in the last model (i.e., H0.1). In panel b), λ2−10keV corresponds to the average X-ray luminosity during the Fermi/LAT observations (see text). This differs in some objects by up to a factor of 2 relative to panel a). The point for Cyg X-1 shows the hard state parameters according to Malyshev et al. (2013).
Current usage metrics show cumulative count of Article Views (full-text article views including HTML views, PDF and ePub downloads, according to the available data) and Abstracts Views on Vision4Press platform.
Data correspond to usage on the plateform after 2015. The current usage metrics is available 48-96 hours after online publication and is updated daily on week days.
Initial download of the metrics may take a while.