Fig. 5
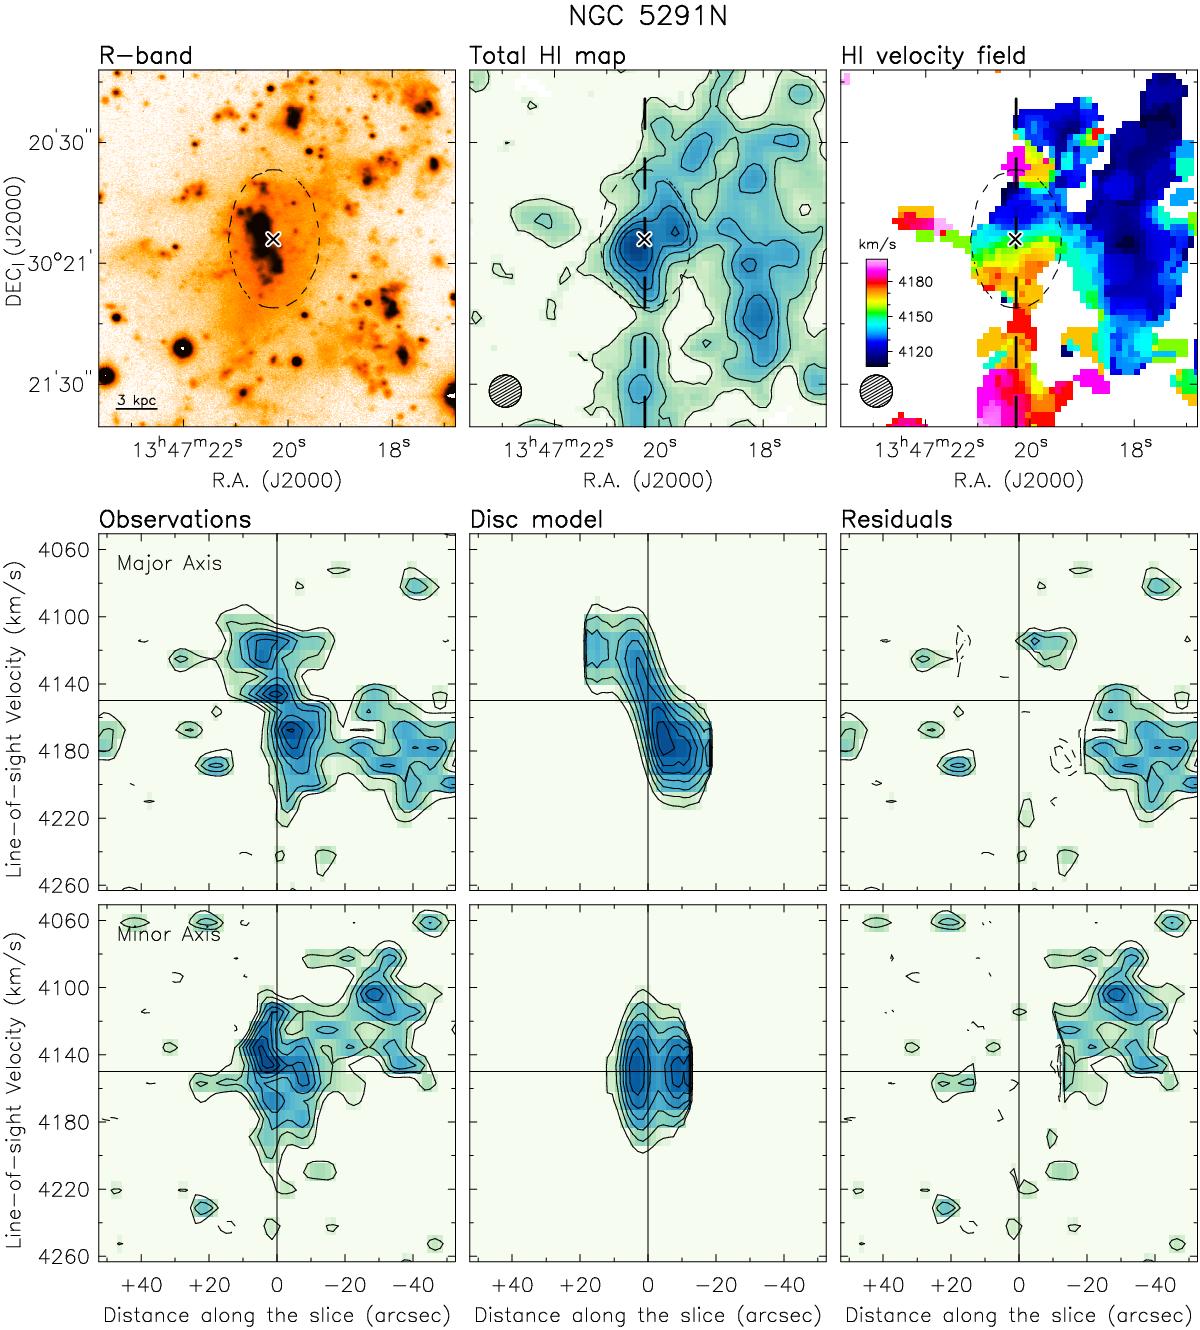
Top panels: optical image (left), total H I map (middle), and H I velocity field (right). The dashed ellipse corresponds to the disc model described in Sect. 5.1. The cross and dashed line illustrate the kinematical centre and major axis, respectively. In the bottom-left corner, we show the linear scale (optical image) and the H I beam (total H I map and velocity field) as given in Table 6. In the total H I map, contours are at ~4.5, 9, 13.5, 18, and 22.5 M⊙ pc-2. Bottom panels: PV diagrams obtained from the observed cube (left), model cube (middle), and residual cube (right) along the major and minor axes. Solid contours range from 2σ to 8σ in steps of 1σ. Dashed contours range from −2σ to −4σ in steps of −1σ. The horizontal and vertical lines correspond to the systemic velocity and dynamical centre, respectively.
Current usage metrics show cumulative count of Article Views (full-text article views including HTML views, PDF and ePub downloads, according to the available data) and Abstracts Views on Vision4Press platform.
Data correspond to usage on the plateform after 2015. The current usage metrics is available 48-96 hours after online publication and is updated daily on week days.
Initial download of the metrics may take a while.