Fig. A.1
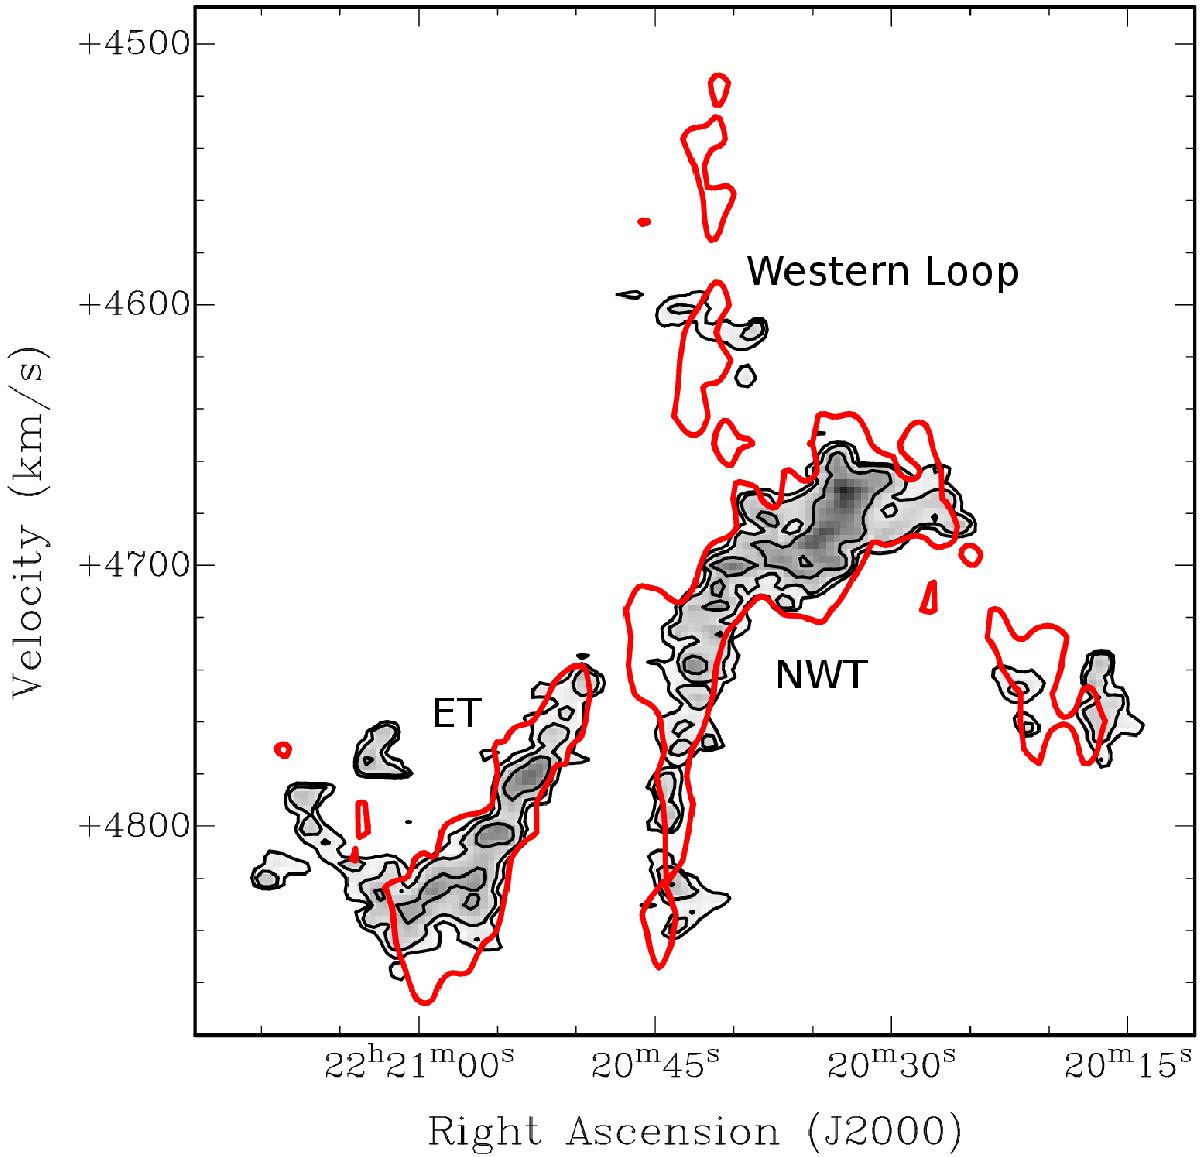
PV diagram for NGC 7252 obtained by integrating the H I emission along the declination axis. The new data are shown in greyscale. Contours are at 18, 36, and 72 mJy/beam. The archival data (published by Hibbard et al. 1994) are represented with a red contour at 18 mJy/beam. Both datasets were spatially smoothed to 25′′ resolution.
Current usage metrics show cumulative count of Article Views (full-text article views including HTML views, PDF and ePub downloads, according to the available data) and Abstracts Views on Vision4Press platform.
Data correspond to usage on the plateform after 2015. The current usage metrics is available 48-96 hours after online publication and is updated daily on week days.
Initial download of the metrics may take a while.