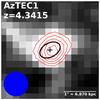
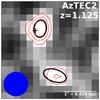
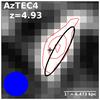
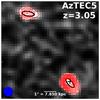
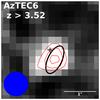
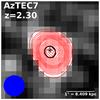
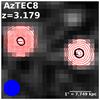
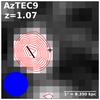
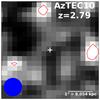
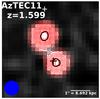
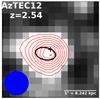
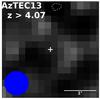
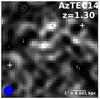
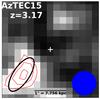
Fig. 2
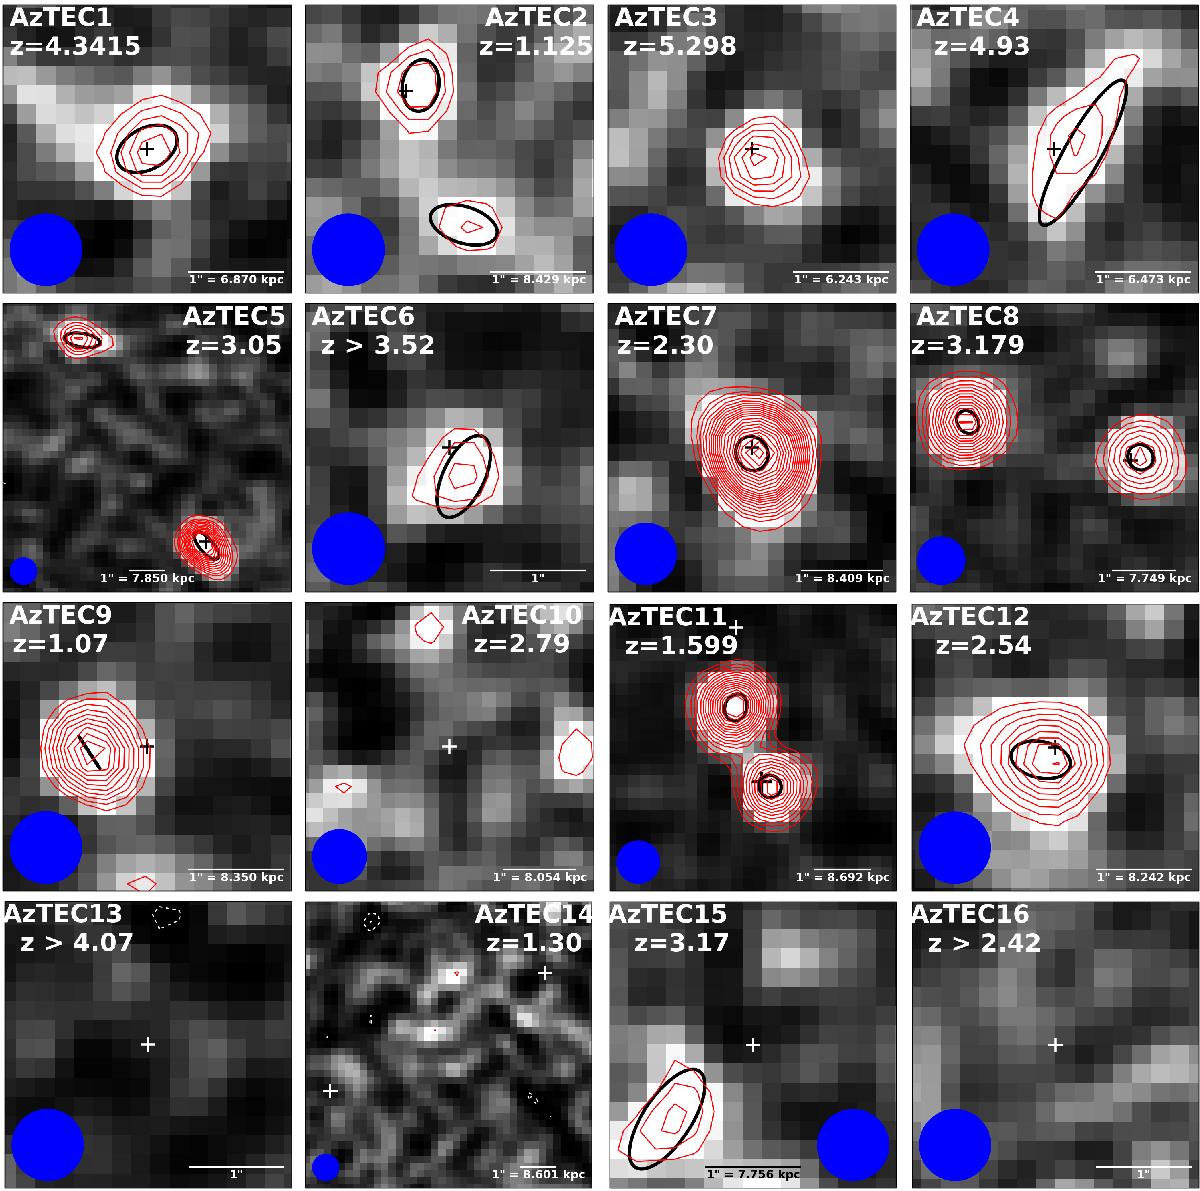
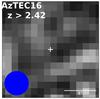
VLA 3 GHz images towards AzTEC1–30 displayed with north up and east left. The greyscale images are shown with power-law scaling (except for AzTEC28, where arcsinh scaling is used to better illustrate the intensity scale; a power-law scaling would be completely black), and the overlaid red contours start from 3σ and increase in steps of 1σ except for AzTEC5, 7, 8, 11, 12, 22, and 24 where the step is ![]() . The white dashed contours show the corresponding negative features (starting from −3σ). The plus sign in each panel marks the (sub)mm peak position (SMA 890 μm for AzTEC1–15: PdBI 1.3 mm for AzTEC16–30). The black thick ellipse shows the resulting Gaussian fit to the source (centred at the peak position, FWHM size, and PA). For AzTEC2 (both components), 3, 4, 5 (both components), 7, 8 (both components), 11-N, 11-S, and 12 the size represents an upper limit (see Table 2). Moreover, for AzTEC4 the peak position was not well determined, and for AzTEC9, 17a, and 27 only the major axis FWHM could be determined by JMFIT. The blue filled circle shows the synthesised beam size (
. The white dashed contours show the corresponding negative features (starting from −3σ). The plus sign in each panel marks the (sub)mm peak position (SMA 890 μm for AzTEC1–15: PdBI 1.3 mm for AzTEC16–30). The black thick ellipse shows the resulting Gaussian fit to the source (centred at the peak position, FWHM size, and PA). For AzTEC2 (both components), 3, 4, 5 (both components), 7, 8 (both components), 11-N, 11-S, and 12 the size represents an upper limit (see Table 2). Moreover, for AzTEC4 the peak position was not well determined, and for AzTEC9, 17a, and 27 only the major axis FWHM could be determined by JMFIT. The blue filled circle shows the synthesised beam size (![]() FWHM). We note that the areal coverage of the images differs from each other for illustrative purposes; a scale bar indicating the 1″ projected length is shown in each panel, annotated with the corresponding proper length [kpc] at the quoted SMG redshift (except when only a lower limit to z is available).
FWHM). We note that the areal coverage of the images differs from each other for illustrative purposes; a scale bar indicating the 1″ projected length is shown in each panel, annotated with the corresponding proper length [kpc] at the quoted SMG redshift (except when only a lower limit to z is available).
Current usage metrics show cumulative count of Article Views (full-text article views including HTML views, PDF and ePub downloads, according to the available data) and Abstracts Views on Vision4Press platform.
Data correspond to usage on the plateform after 2015. The current usage metrics is available 48-96 hours after online publication and is updated daily on week days.
Initial download of the metrics may take a while.