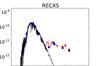
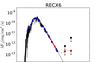
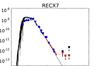
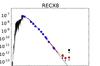
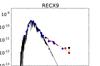
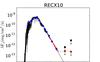
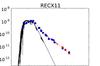
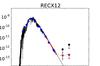
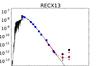
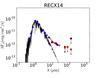
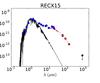
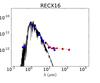
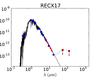
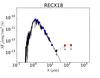
Fig. 8
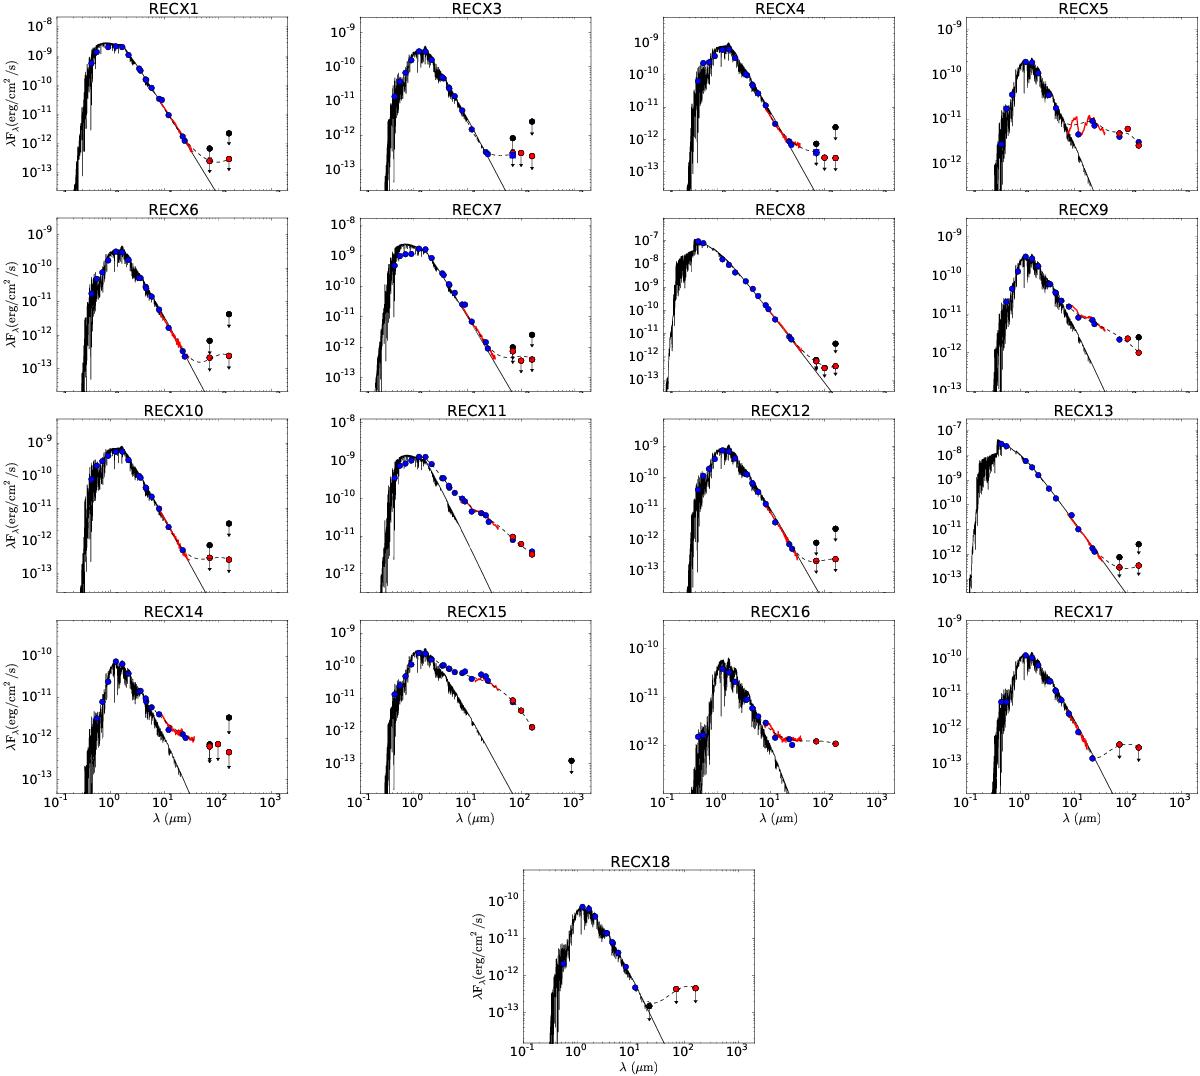
SEDs of η Cha members observed with PACS photometry. PACS observations are shown as red dots. Blue dots depict photometry at different wavelengths from 2MASS, WISE, AKARI, and the literature (see Sect. 2). The blue squares in the RECX 3 and RECX 4 SEDs depict PACS photometry from Cieza et al. (2013). 3σ upper limits are shown as black arrows. The red curve depicts the IRS spectrum. The black solid curve is the photospheric model. The black dashed curve depicts the 3rd degree spline used to compute the infrared excess. The source names are shown at the top of each panel.
Current usage metrics show cumulative count of Article Views (full-text article views including HTML views, PDF and ePub downloads, according to the available data) and Abstracts Views on Vision4Press platform.
Data correspond to usage on the plateform after 2015. The current usage metrics is available 48-96 hours after online publication and is updated daily on week days.
Initial download of the metrics may take a while.