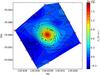
Fig. 7
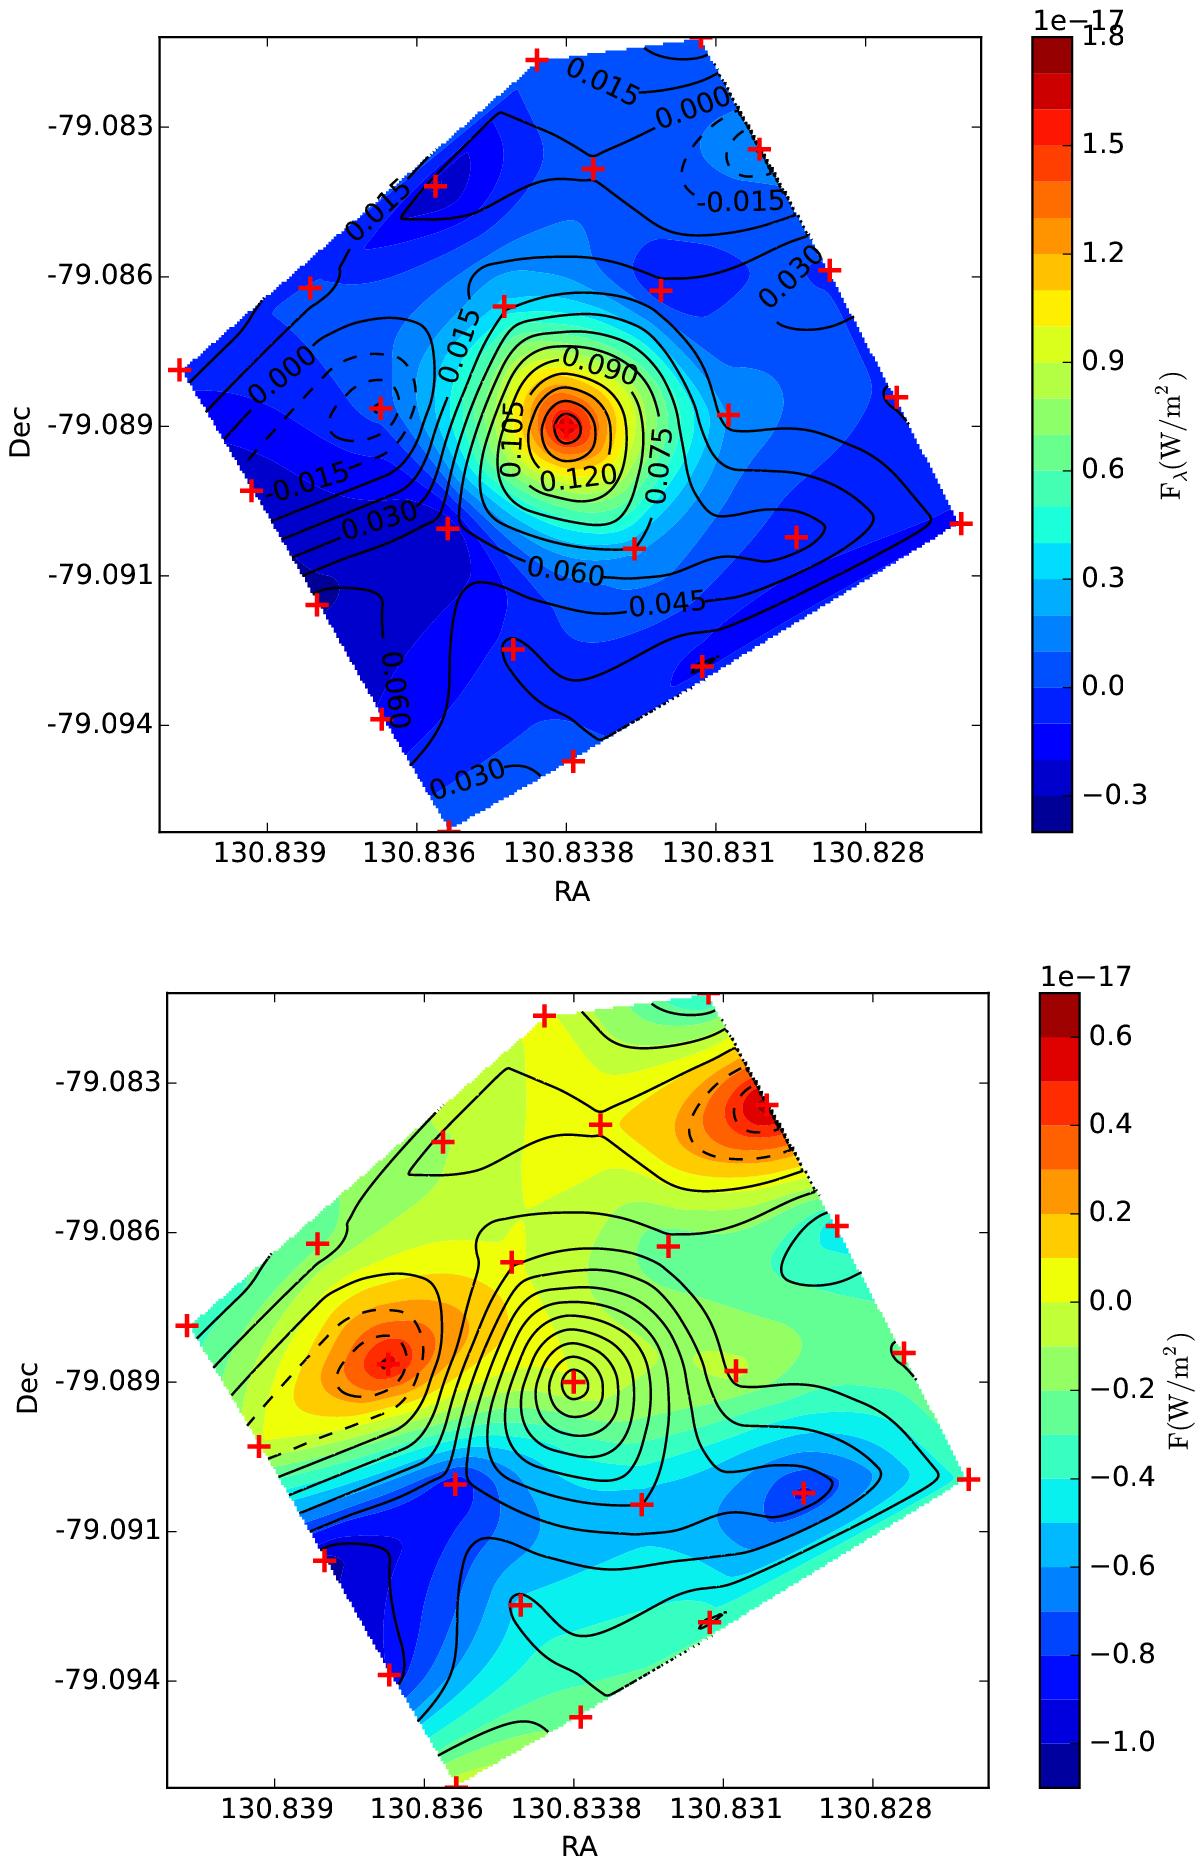
Top: contours for line (coloured contours) and continuum at 63 μm emission in RECX 15 (solid and dashed line contours, where dashed lines represent negative values). Continuum units are in Jy. Bottom: line residual emission for RECX 15 at 63 μm (see Sect. 4.2) from the tests by Podio et al. (2012). Continuum contours are also shown, following the top panel. Red plus signs mark the central positions of the PACS spectrometer spaxels. No significant residual emission is detected.
Current usage metrics show cumulative count of Article Views (full-text article views including HTML views, PDF and ePub downloads, according to the available data) and Abstracts Views on Vision4Press platform.
Data correspond to usage on the plateform after 2015. The current usage metrics is available 48-96 hours after online publication and is updated daily on week days.
Initial download of the metrics may take a while.