Fig. 13
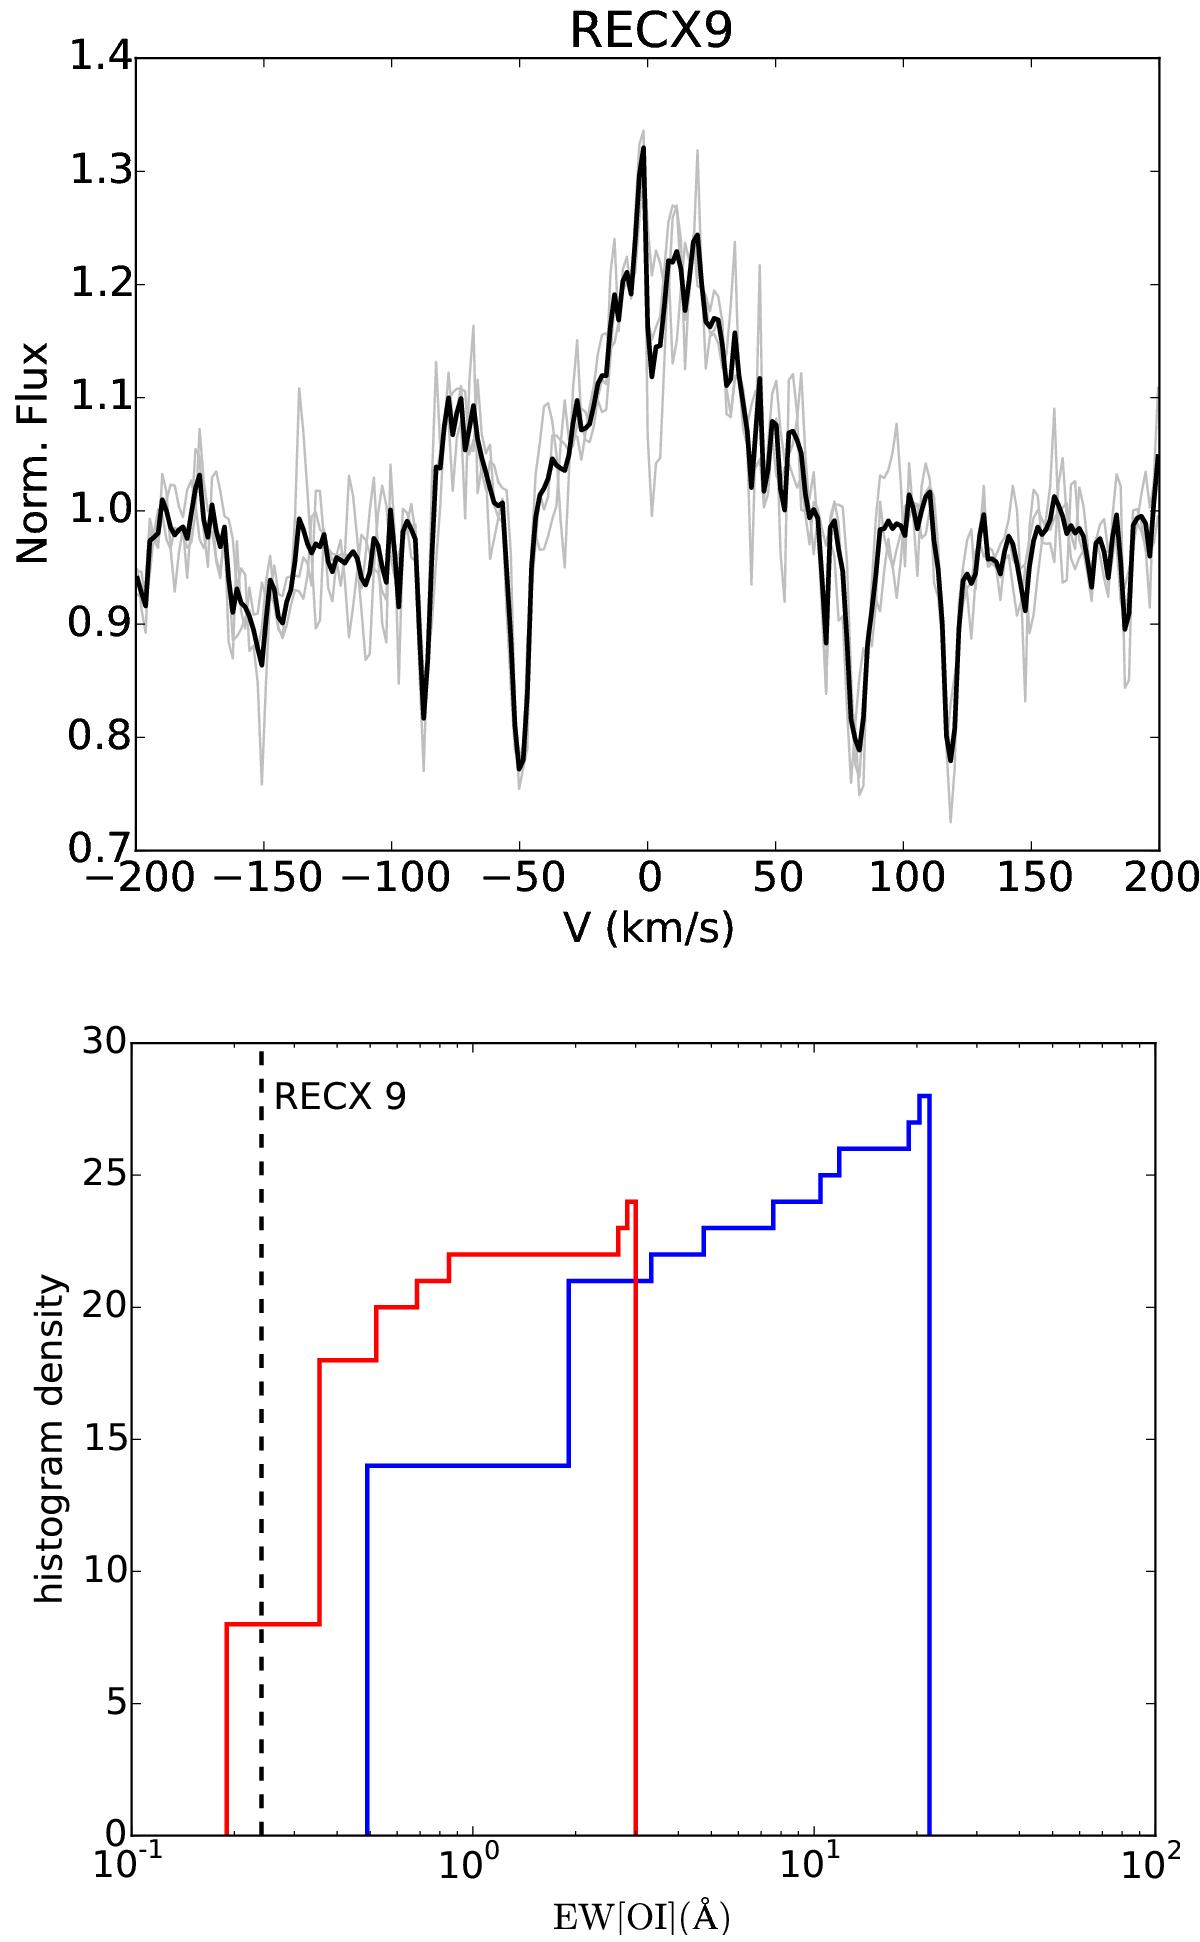
Top: UVES spectra of RECX 9 members at 6300 Å centred on the [OI] line. Gray curves show individual epochs, while the black curve shows the average spectrum from all epochs. Bottom: cumulative histogram of [OI] EW at 6300 Å from Hartigan et al. (1995). Sources with an identified jet are shown in blue, while sources without a jet signature are shown in red. The vertical dashed line marks the position of RECX 9 [OI] EW at 6300 Å.
Current usage metrics show cumulative count of Article Views (full-text article views including HTML views, PDF and ePub downloads, according to the available data) and Abstracts Views on Vision4Press platform.
Data correspond to usage on the plateform after 2015. The current usage metrics is available 48-96 hours after online publication and is updated daily on week days.
Initial download of the metrics may take a while.