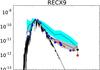
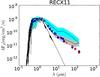
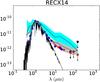
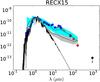
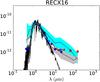
Fig. 10
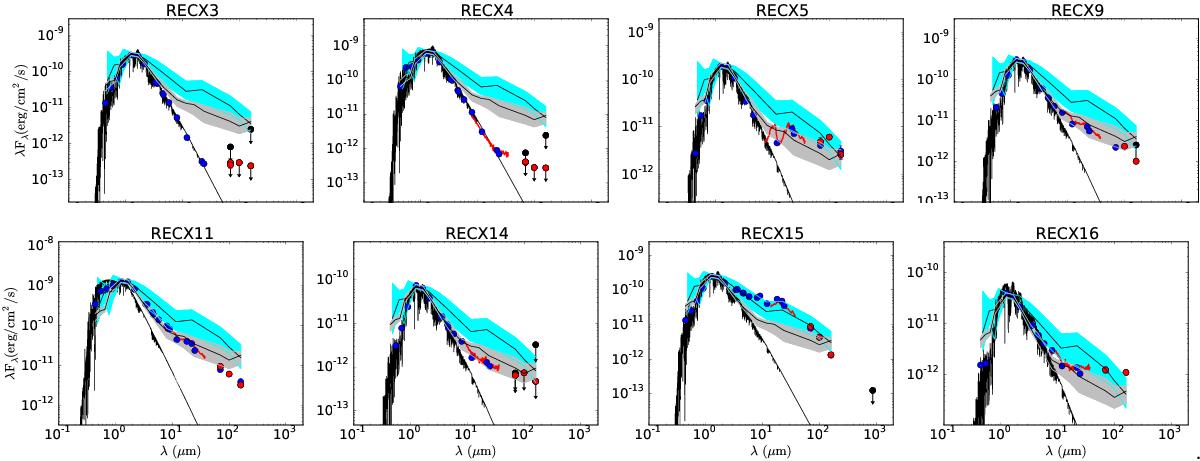
SEDs of η Cha members detected with PACS photometry compared to the median SED in Taurus (cyan) and Upper Scorpius (grey) from Mathews et al. (2013). Blue dots depict archival photometry, while the red ones are PACS photometry from the present study. Black arrows are upper limits. The red curve depicts the IRS spectrum, while the black one represents the photospheric model.
Current usage metrics show cumulative count of Article Views (full-text article views including HTML views, PDF and ePub downloads, according to the available data) and Abstracts Views on Vision4Press platform.
Data correspond to usage on the plateform after 2015. The current usage metrics is available 48-96 hours after online publication and is updated daily on week days.
Initial download of the metrics may take a while.