Free Access
Fig. 3
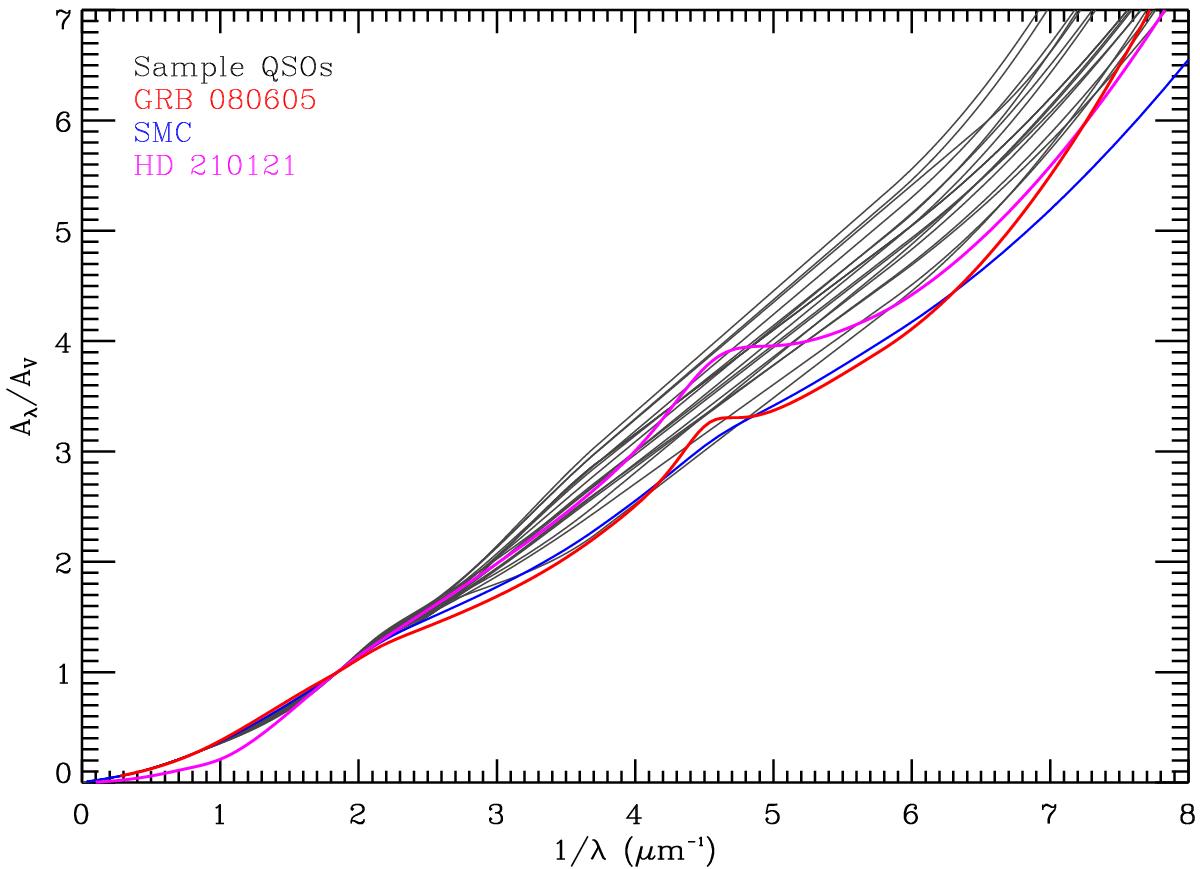
Individual extinction curves of the QSO sample compared with the extinction curves of GRB 080605 (Zafar et al. 2012), average SMC Bar (Gordon et al. 2003), and MW sightline HD 210121 (Fitzpatrick & Massa 2007). The QSO extinction curves derived in this work appear to be steeper than the other environments.
Current usage metrics show cumulative count of Article Views (full-text article views including HTML views, PDF and ePub downloads, according to the available data) and Abstracts Views on Vision4Press platform.
Data correspond to usage on the plateform after 2015. The current usage metrics is available 48-96 hours after online publication and is updated daily on week days.
Initial download of the metrics may take a while.