Fig. 1
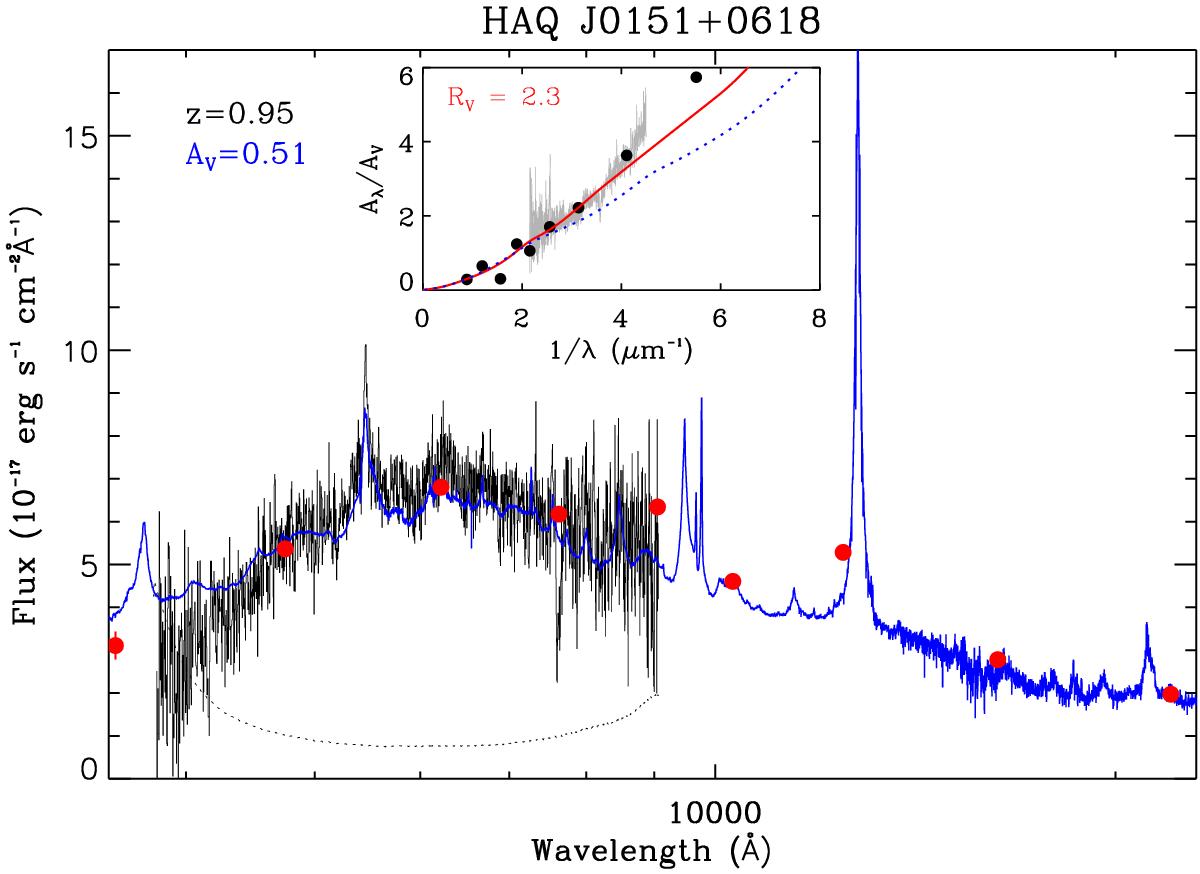
SED of HAQ J0151+0618. The solid and dotted lines represent the observed and error spectrum, respectively. The spectra are binned by a factor of 2 for plotting purposes. The redshift and the rest-frame visual extinction, AV, is provided in the top left corner. The blue curve represents the combined QSO template from Vanden Berk et al. (2001) and Glikman et al. (2006) redshifted to the estimated redshift and reddened by the indicated amount of extinction. Red filled circles correspond to the SDSS and UKIDSS photometry. Inset: extinction curve of HAQ J0151+0618 based on the best-fit model given in Table 1. The grey curve represents the spectrum. The black circles correspond to the SDSS and UKIDSS photometry. The red solid curve corresponds to the best-fit dust extinction model. The average SMC Bar (blue dotted line) extinction model from Gordon et al. (2003) is also shown. The complete SEDs of the QSO sample are shown in Fig. A.1.
Current usage metrics show cumulative count of Article Views (full-text article views including HTML views, PDF and ePub downloads, according to the available data) and Abstracts Views on Vision4Press platform.
Data correspond to usage on the plateform after 2015. The current usage metrics is available 48-96 hours after online publication and is updated daily on week days.
Initial download of the metrics may take a while.