Fig. 7
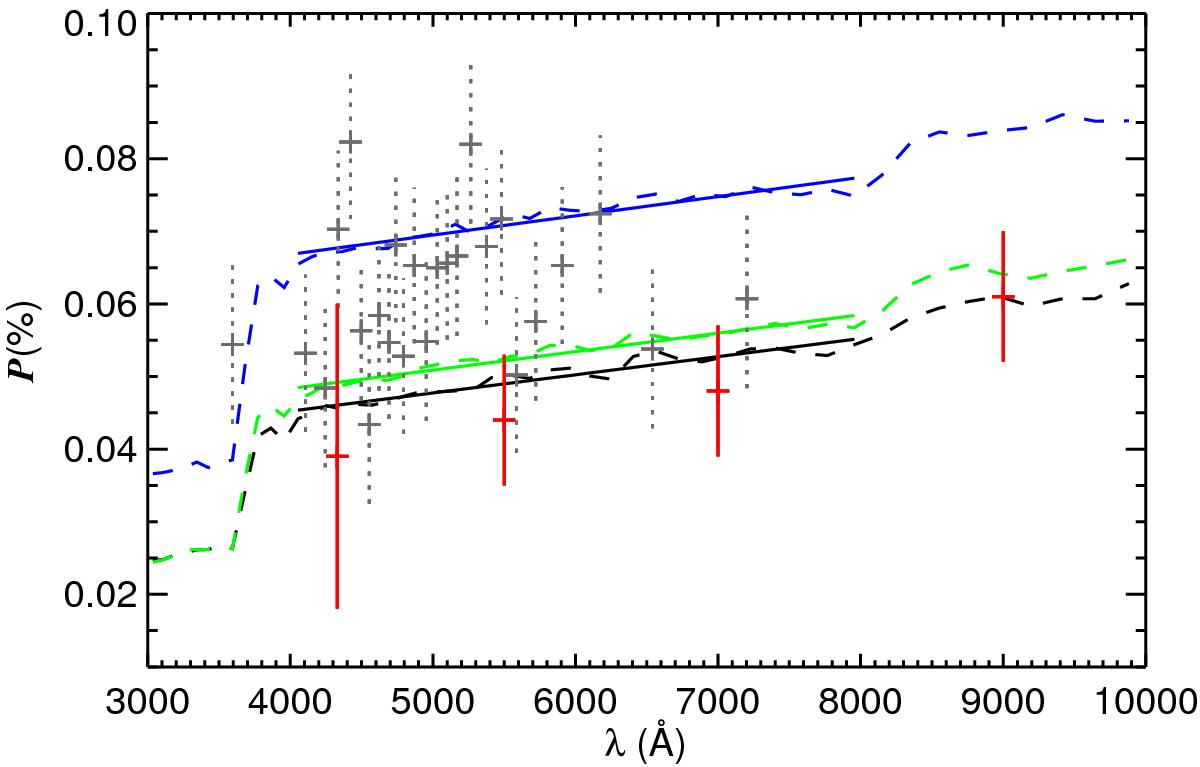
Spectral shapes of polarization (dashed lines) overplotted with their linear fits (solid lines) in the Paschen continuum: parametric model with n = 3.5 (black), parametric model with n = 3.0 (blue), and self-consistent model (green). The OPD measurements are plotted in red and for comparison we show the binned 1991 HPOL measurement (gray plus signs with dotted error bars).
Current usage metrics show cumulative count of Article Views (full-text article views including HTML views, PDF and ePub downloads, according to the available data) and Abstracts Views on Vision4Press platform.
Data correspond to usage on the plateform after 2015. The current usage metrics is available 48-96 hours after online publication and is updated daily on week days.
Initial download of the metrics may take a while.