Fig. 6
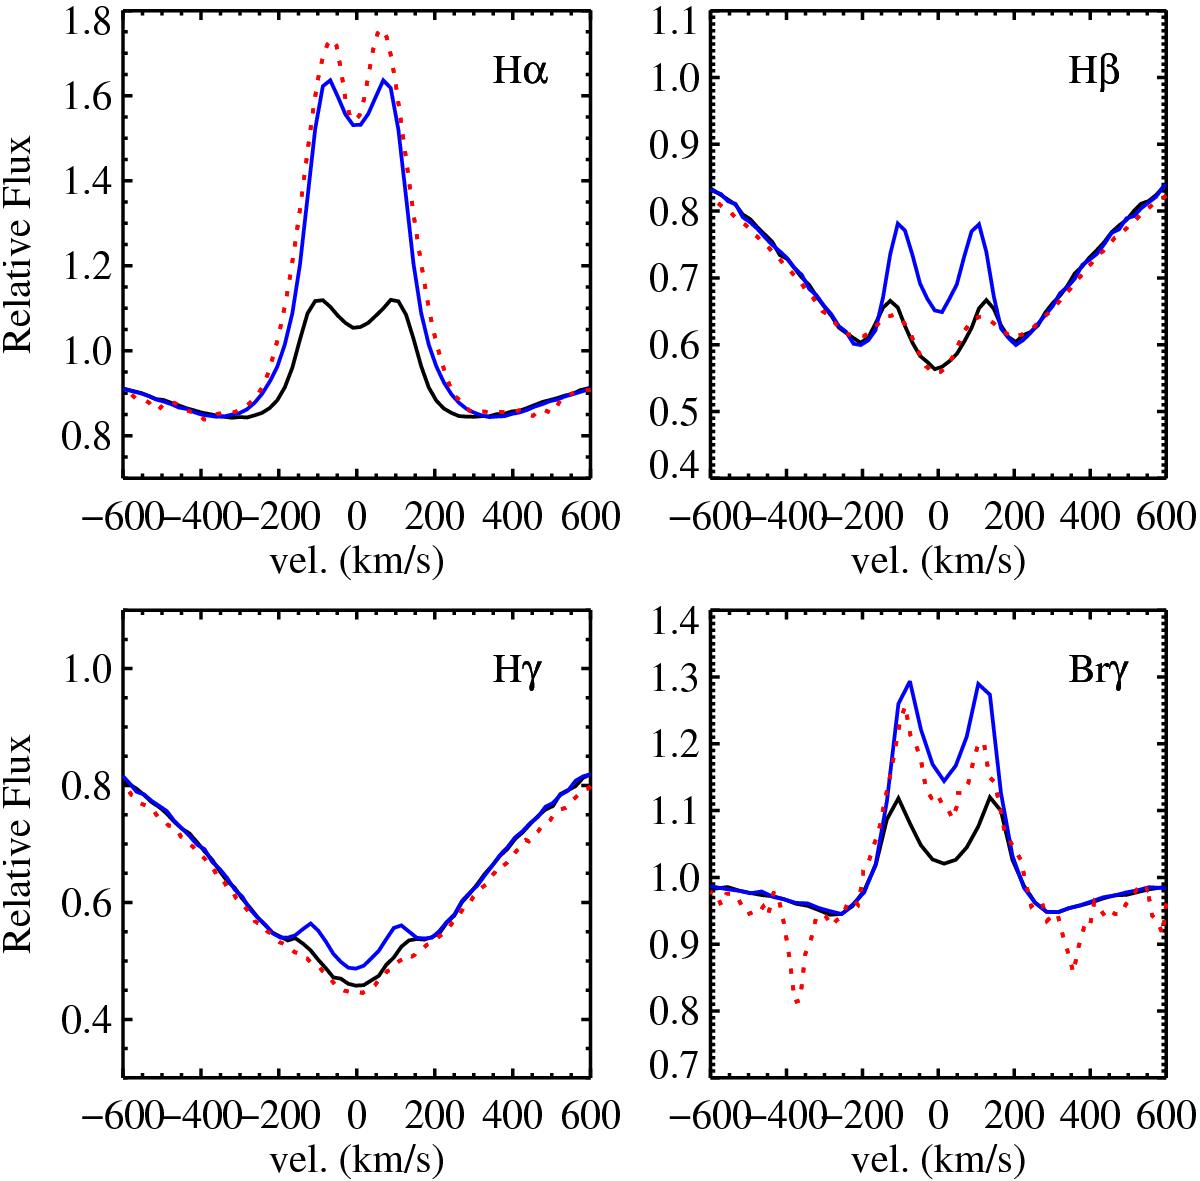
Hydrogen line profiles for the parametric model (solid lines) with n = 3.5 (black) and n = 3.0 (blue) compared to the averaged observed hydrogen line profiles (dotted red lines). The self-consistent model (not shown) is almost identical to the n = 3.5 parametric model. While Hβ and Hγ are reproduced well with n = 3.5, Hα and Brγ need n = 3.0 for their emission to reach the observed values.
Current usage metrics show cumulative count of Article Views (full-text article views including HTML views, PDF and ePub downloads, according to the available data) and Abstracts Views on Vision4Press platform.
Data correspond to usage on the plateform after 2015. The current usage metrics is available 48-96 hours after online publication and is updated daily on week days.
Initial download of the metrics may take a while.