Fig. 4
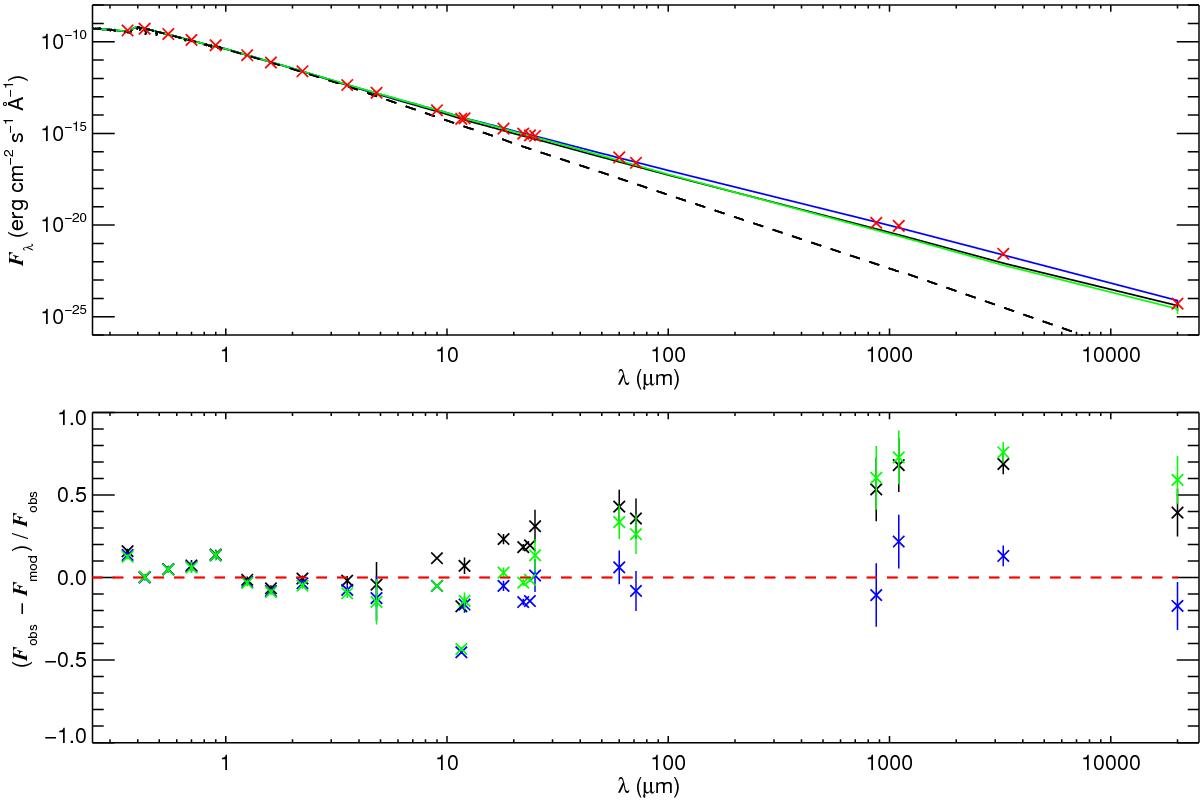
Upper: parametric model with n = 3.5 (black), parametric model with n = 3.0 (blue), and self-consistent model (green) fit to the visual, IR, and radio SED (red plus signs). All models are plotted for Rout = 35 Rp. The purely photospheric SED is plotted as a black dashed line. Lower: residuals of each model fit. The error bars are plotted where available.
Current usage metrics show cumulative count of Article Views (full-text article views including HTML views, PDF and ePub downloads, according to the available data) and Abstracts Views on Vision4Press platform.
Data correspond to usage on the plateform after 2015. The current usage metrics is available 48-96 hours after online publication and is updated daily on week days.
Initial download of the metrics may take a while.