Fig. 17
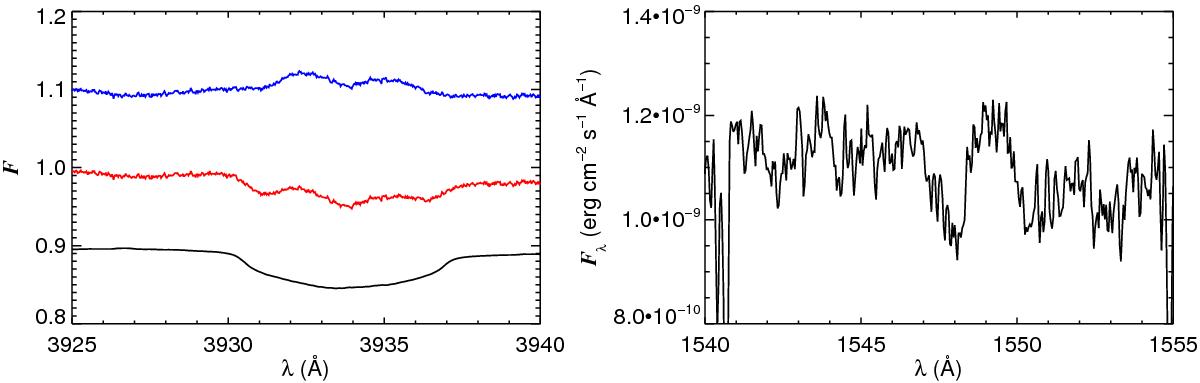
Left: CaII λ3934 line. The purely photospheric model absorption (black) is plotted alongside the normalized ESPaDOnS spectrum (red) and their difference is plotted in blue. The emission component is clearly narrower than the absorption. Right: CIV λ1548 line as observed by IUE showing a clear P Cygni profile.
Current usage metrics show cumulative count of Article Views (full-text article views including HTML views, PDF and ePub downloads, according to the available data) and Abstracts Views on Vision4Press platform.
Data correspond to usage on the plateform after 2015. The current usage metrics is available 48-96 hours after online publication and is updated daily on week days.
Initial download of the metrics may take a while.