Fig. 16
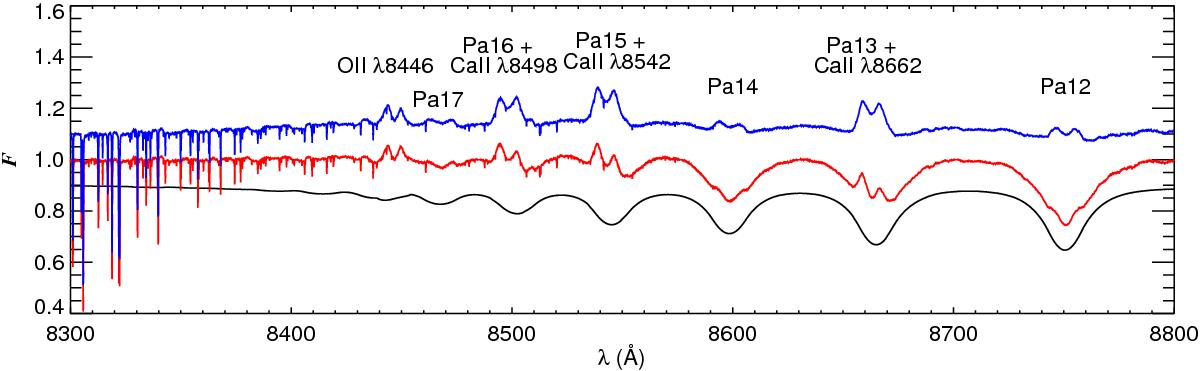
Ca triplet spectral feature. The BRUCE model photospheric spectrum (black) is plotted alongside the averaged normalized spectrum observed by ESPaDOnS (red) and the difference between the two, which represents the pure emission component (blue). Both the observed and pure emission spectrum show that the Paschen lines Pa16, Pa15, and Pa13 blended with calcium emission CaII λ8498, 8542, and 8662, respectively, are much stronger than the emission from the unblended Paschen lines.
Current usage metrics show cumulative count of Article Views (full-text article views including HTML views, PDF and ePub downloads, according to the available data) and Abstracts Views on Vision4Press platform.
Data correspond to usage on the plateform after 2015. The current usage metrics is available 48-96 hours after online publication and is updated daily on week days.
Initial download of the metrics may take a while.