Fig. 15
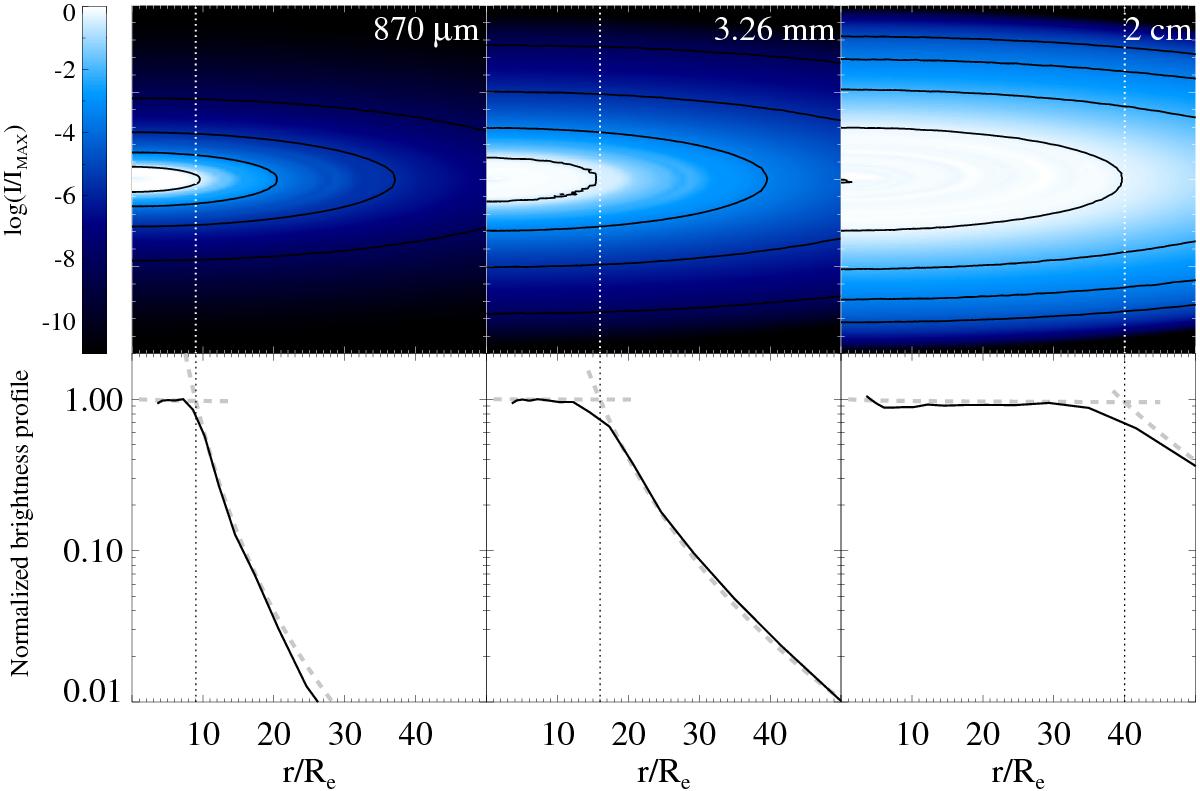
Synthetic images computed with HDUST (upper panels) and their respective radial brightness profile curves (lower panels), at 870 μm, 3.26 mm, and 2 cm. In all cases, the maximum disk emission was normalized to unity. Overplotted to the images are the contours of same flux, at log (I/IMAX) = −0.2, −1.5, −2.5, and −3.5 (which correspond to 63%, 3%, 0.3%, and 0.003% of the disk maximum brightness, respectively). The transition between the optically thick region (pseudophotosphere) and the diffuse part of the disk is indicated by a vertical dotted line over the plots, as estimated from the extrapolation of the distinct brightness profile regions (gray dashed curves).
Current usage metrics show cumulative count of Article Views (full-text article views including HTML views, PDF and ePub downloads, according to the available data) and Abstracts Views on Vision4Press platform.
Data correspond to usage on the plateform after 2015. The current usage metrics is available 48-96 hours after online publication and is updated daily on week days.
Initial download of the metrics may take a while.