Fig. 14
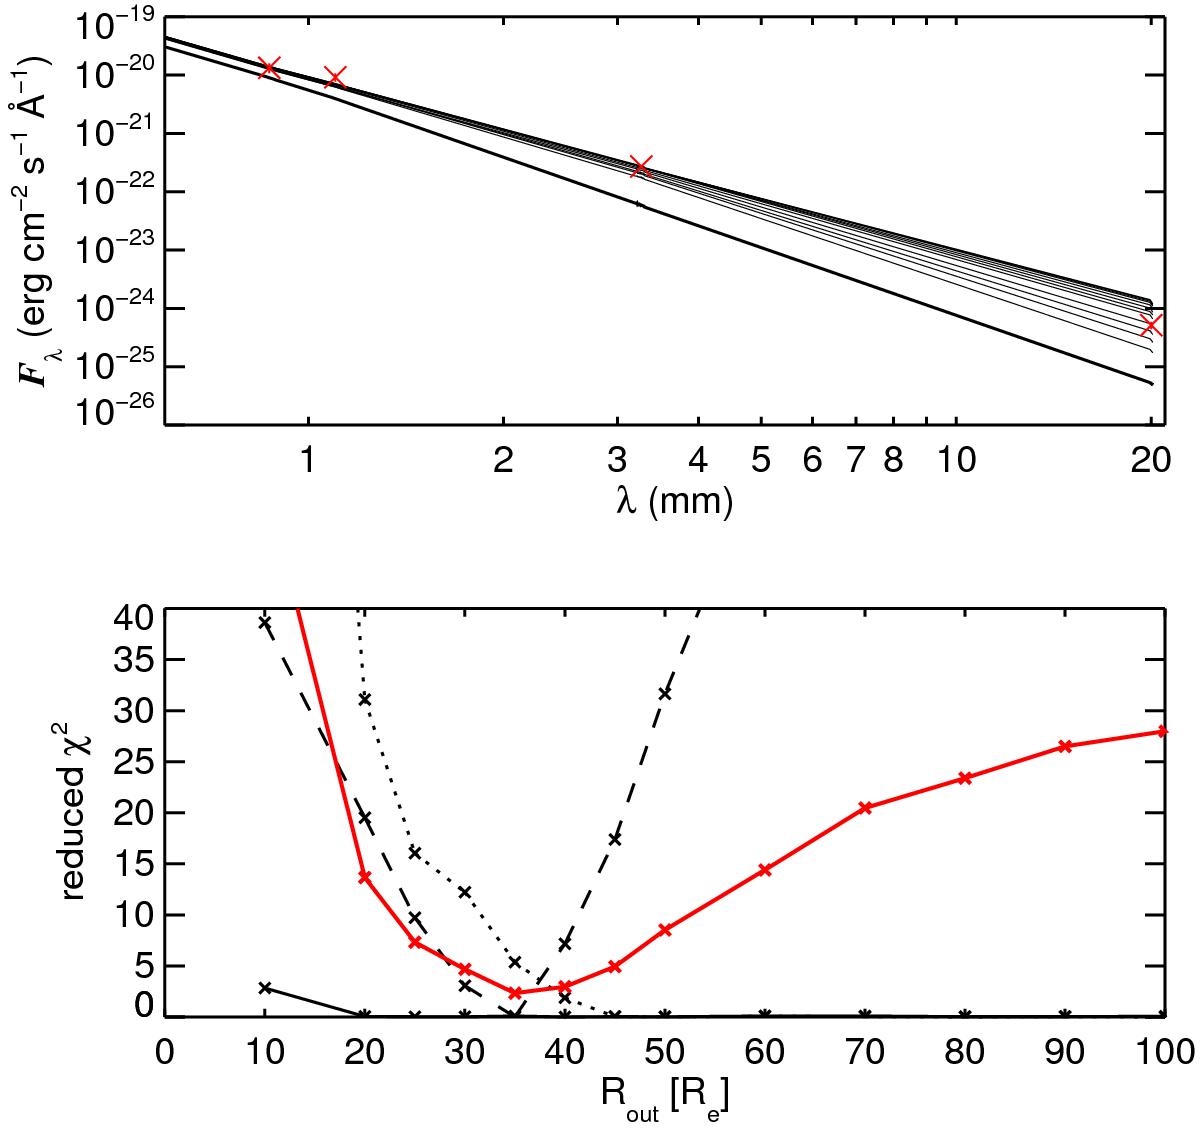
Upper: sub-mm to cm SED structure of the parametric model (n = 3.0). The red crosses correspond to the observed fluxes from APEX (870 μm), JCMT (1.1 mm), CARMA (3.265 mm), and VLA (2 cm). The plotted parametric model (with n = 3.0) SEDs (black solid lines) are for Rout/Re = 10; 20; 25; 30; 35; 40; 45; 50; 60; 70; 80; 90, and 100 from bottom to top. Lower: reduced χ2 dependence on Rout for APEX (solid), CARMA (dotted) and VLA (dashed). The combined χ2 for all four observations is plotted as a red solid line.
Current usage metrics show cumulative count of Article Views (full-text article views including HTML views, PDF and ePub downloads, according to the available data) and Abstracts Views on Vision4Press platform.
Data correspond to usage on the plateform after 2015. The current usage metrics is available 48-96 hours after online publication and is updated daily on week days.
Initial download of the metrics may take a while.