Free Access
Fig. 2
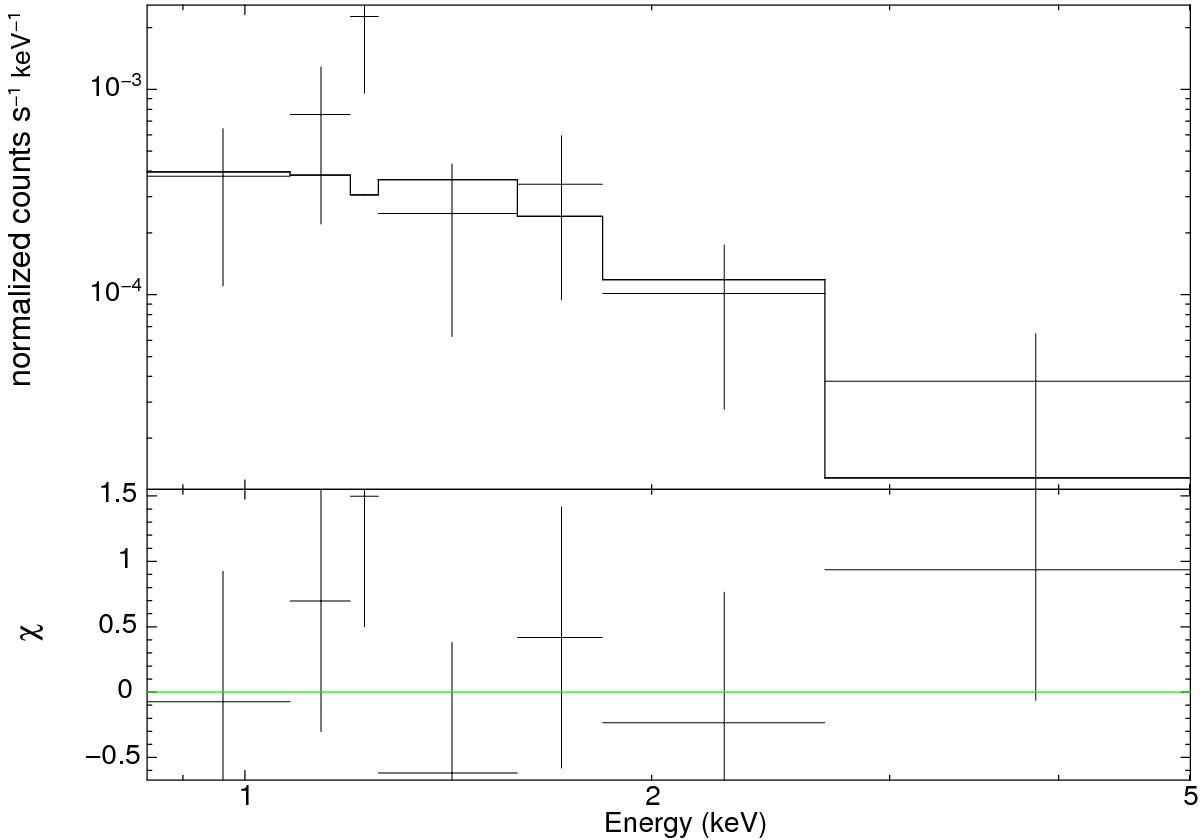
Observed spectra rebinned to 2 cts/bin (points with error bars) and fit (histogram) of our Chandra observation (top plot). The shown fit is relative to the case of binned data with fixed kT of 1 keV (first line of Table 1). Residuals are shown in the bottom plot.
Current usage metrics show cumulative count of Article Views (full-text article views including HTML views, PDF and ePub downloads, according to the available data) and Abstracts Views on Vision4Press platform.
Data correspond to usage on the plateform after 2015. The current usage metrics is available 48-96 hours after online publication and is updated daily on week days.
Initial download of the metrics may take a while.