Fig. 1
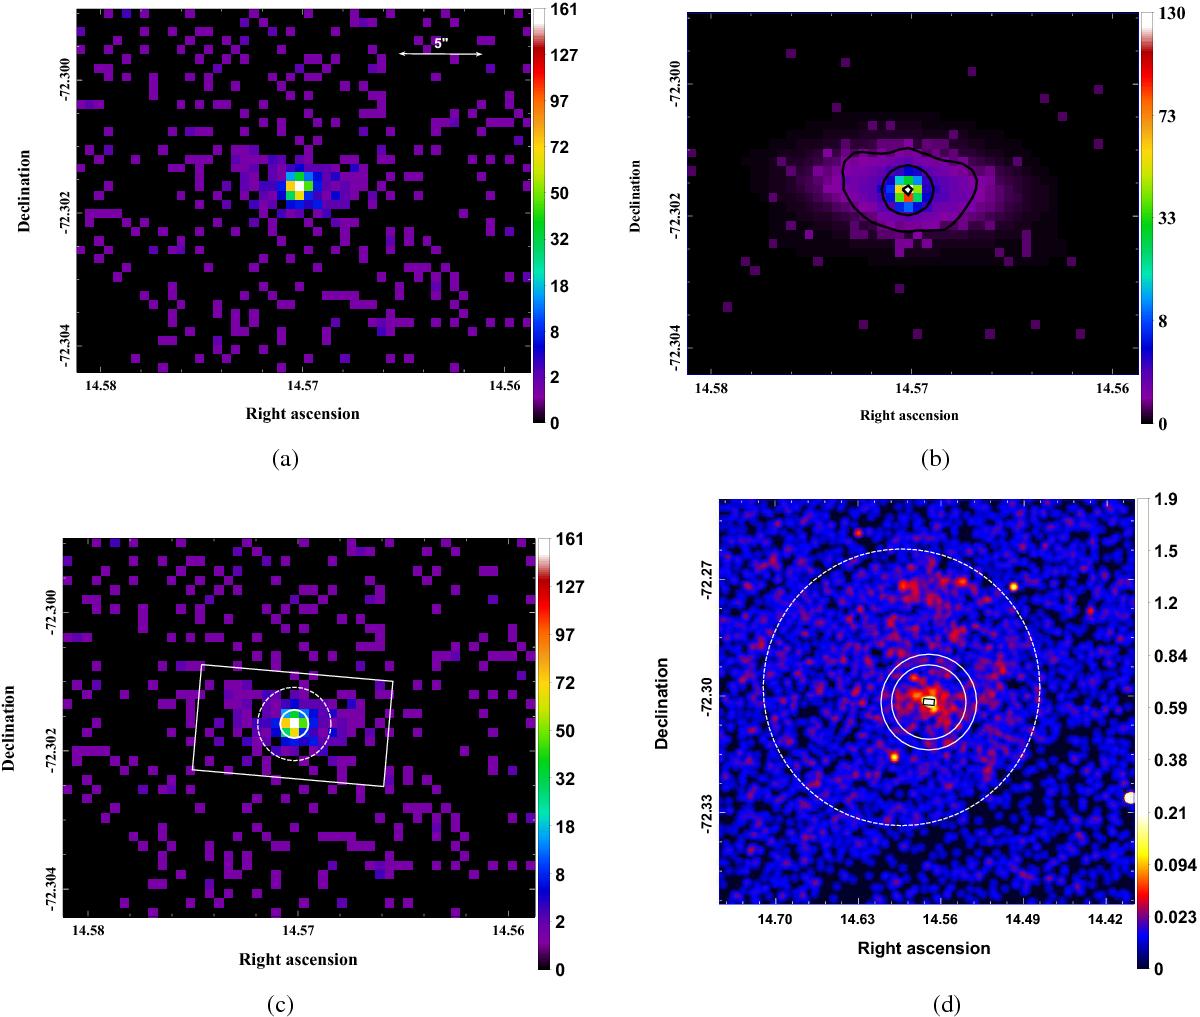
a)Top left: Chandra ACIS-S (0.5–8 keV) full resolution image of the PWN in IKT 16. The image size is 20′′× 25′′. The scale is in square root, the X and Y axis in degrees, and units are counts for all the images. The brightest pixel in the centre corresponds to the putative pulsar. b)Top right: best-fit model of the PWN (0.5–8 keV). Overlayed are contours from the data which have been smoothed with a Gaussian of σ = 3′′. The contour levels are plotted at values of 0.7, 1.6 and 30 counts arcsecs-2. c) Bottom left: same as the top left figure showing the regions used for spectral extraction. The central circle corresponds to the pulsar, and the rectangular box the entire nebula with the central point source removed. The dashed circle corresponds to the outer boundary of the inner, and the inner boundary of the outer nebular extraction regions respectively. d) Bottom right: larger ACIS-S image centred on the PWN of IKT 16 with the box region used for nebular extraction (solid line) and the background annular region (dashed line) overlayed. The point source contribution at the centre has been removed and replaced with values obtained by interpolation from the nebular region.
Current usage metrics show cumulative count of Article Views (full-text article views including HTML views, PDF and ePub downloads, according to the available data) and Abstracts Views on Vision4Press platform.
Data correspond to usage on the plateform after 2015. The current usage metrics is available 48-96 hours after online publication and is updated daily on week days.
Initial download of the metrics may take a while.