Fig. 2
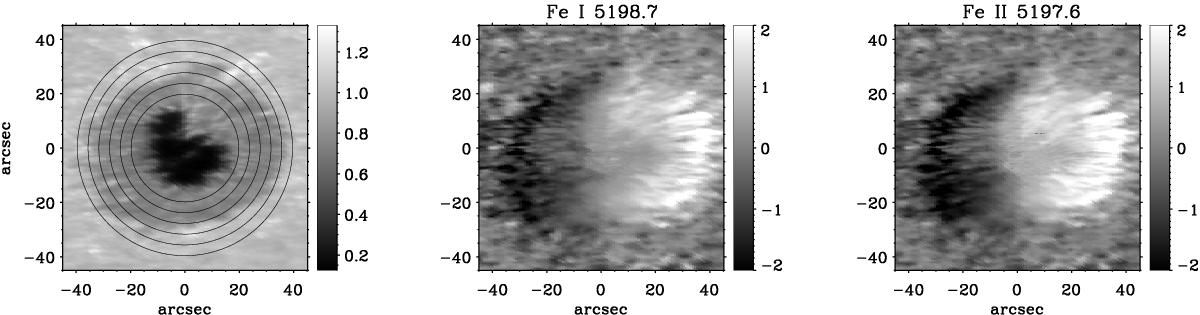
Continuum image and velocities of the Fe i 5198.71 Å and Fe ii 5197.58 Å lines. The velocities are obtained after the λ-meter technique at the position at the wings of each line nearest to the continuum. We note the similarity in the velocity field. The circles in the left panel indicate the rings in the penumbra where we performed the fit to the velocities.
Current usage metrics show cumulative count of Article Views (full-text article views including HTML views, PDF and ePub downloads, according to the available data) and Abstracts Views on Vision4Press platform.
Data correspond to usage on the plateform after 2015. The current usage metrics is available 48-96 hours after online publication and is updated daily on week days.
Initial download of the metrics may take a while.