Free Access
Fig. 7
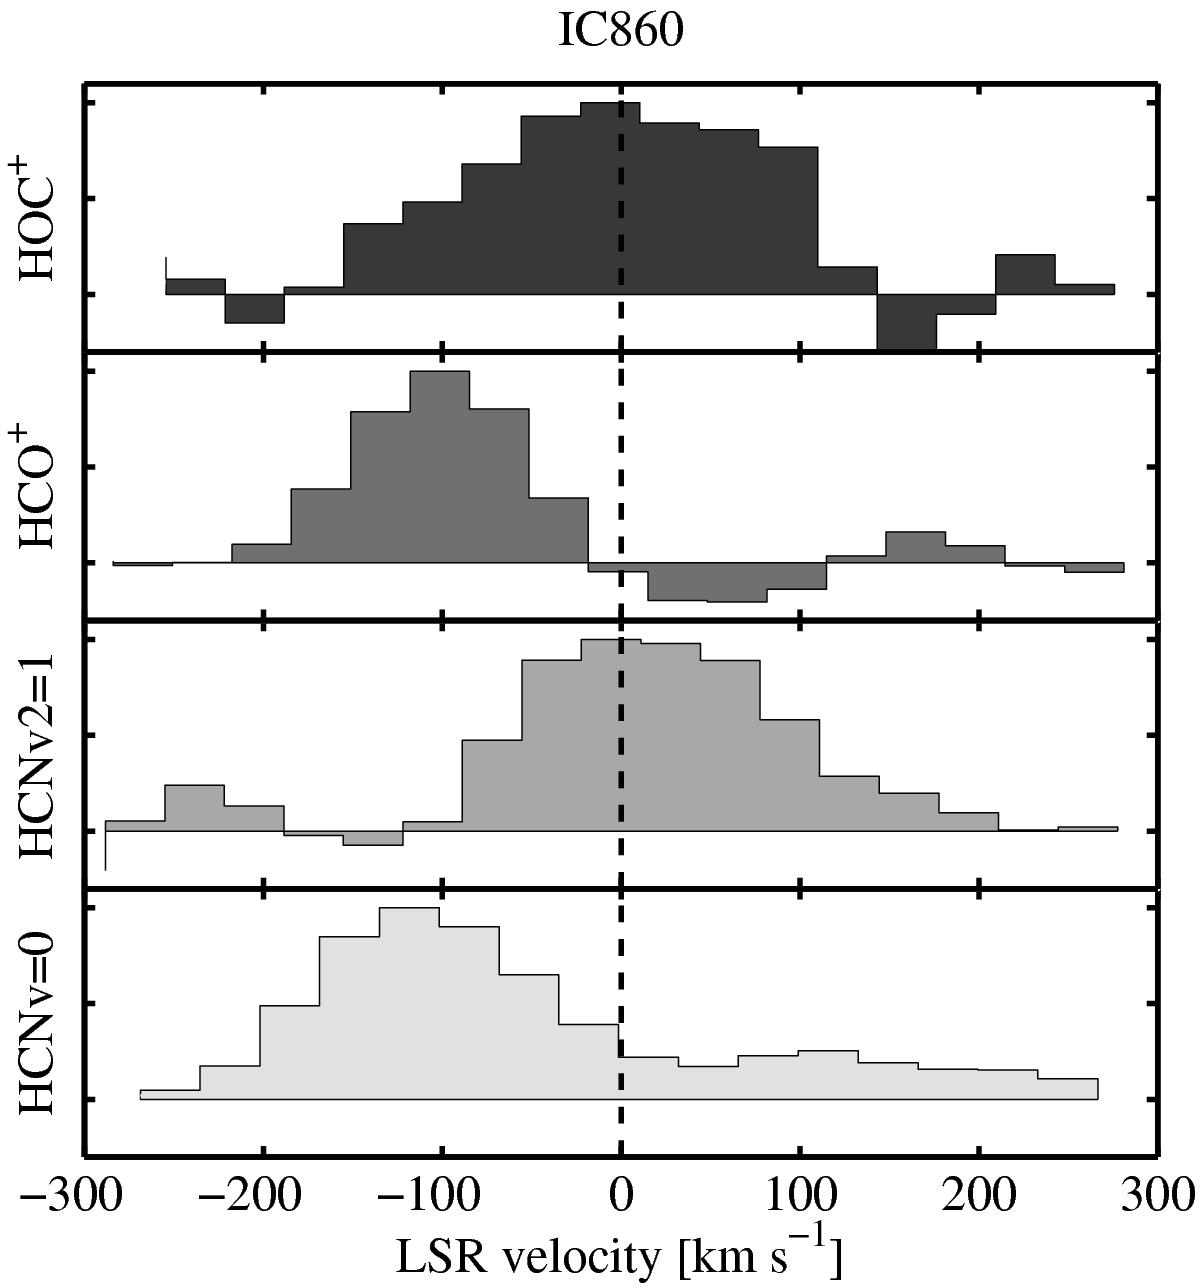
Zoom in on the spectral structure of HOC+, HCO+ (top two panels) and HCN-VIB, HCN (lower two panels) of IC 860 showing the self-absorbed line shapes of HCN, HCO+ while the other two lines peak at systemic velocity. The intensities have been normalized.
Current usage metrics show cumulative count of Article Views (full-text article views including HTML views, PDF and ePub downloads, according to the available data) and Abstracts Views on Vision4Press platform.
Data correspond to usage on the plateform after 2015. The current usage metrics is available 48-96 hours after online publication and is updated daily on week days.
Initial download of the metrics may take a while.